|
Download Data (XLS File) |
|
||||||||
|
||||||||
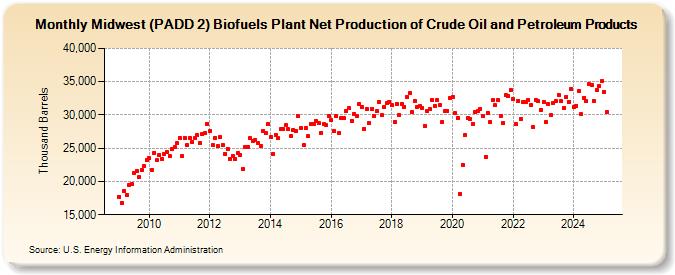
| Midwest (PADD 2) Biofuels Plant Net Production of Crude Oil and Petroleum Products (Thousand Barrels) | ||||||||
| Year | Jan | Feb | Mar | Apr | May | Jun | Jul | Aug | Sep | Oct | Nov | Dec |
|---|---|---|---|---|---|---|---|---|---|---|---|---|
| 2009 | 17,706 | 16,787 | 18,566 | 17,949 | 19,484 | 19,642 | 21,320 | 21,500 | 20,625 | 21,691 | 22,293 | 23,182 |
| 2010 | 23,488 | 21,777 | 24,325 | 23,186 | 24,018 | 23,440 | 24,099 | 24,438 | 23,825 | 24,816 | 25,156 | 25,711 |
| 2011 | 26,581 | 23,761 | 26,581 | 25,424 | 26,559 | 25,914 | 26,527 | 26,927 | 25,710 | 27,060 | 27,259 | 28,697 |
| 2012 | 27,550 | 25,468 | 26,586 | 25,295 | 26,674 | 25,464 | 24,174 | 24,911 | 23,321 | 23,803 | 23,364 | 24,289 |
| 2013 | 23,968 | 21,895 | 25,112 | 25,195 | 26,491 | 26,112 | 26,275 | 25,755 | 25,268 | 27,645 | 27,223 | 28,615 |
| 2014 | 26,661 | 24,158 | 27,043 | 26,509 | 27,880 | 27,829 | 28,433 | 27,828 | 26,790 | 27,754 | 27,560 | 29,767 |
| 2015 | 28,061 | 25,416 | 28,076 | 26,772 | 28,630 | 28,705 | 29,156 | 28,746 | 27,357 | 28,588 | 28,439 | 29,822 |
| 2016 | 29,173 | 27,619 | 29,765 | 27,220 | 29,481 | 29,507 | 30,521 | 30,979 | 29,152 | 30,192 | 29,813 | 31,632 |
| 2017 | 31,160 | 27,934 | 30,941 | 28,784 | 30,940 | 29,845 | 30,545 | 31,945 | 29,937 | 31,227 | 31,768 | 32,006 |
| 2018 | 31,448 | 29,000 | 31,656 | 29,934 | 31,632 | 31,243 | 32,762 | 33,330 | 30,393 | 32,129 | 31,241 | 31,340 |
| 2019 | 31,110 | 28,343 | 30,553 | 30,828 | 32,245 | 31,412 | 32,222 | 31,551 | 28,981 | 30,535 | 30,651 | 32,485 |
| 2020 | 32,725 | 30,236 | 29,553 | 18,164 | 22,534 | 26,944 | 29,551 | 29,364 | 28,695 | 30,380 | 30,551 | 30,891 |
| 2021 | 29,810 | 23,741 | 30,329 | 28,900 | 32,252 | 31,435 | 32,169 | 29,851 | 28,787 | 32,928 | 32,860 | 33,673 |
| 2022 | 32,325 | 28,613 | 32,164 | 29,443 | 31,913 | 31,949 | 32,252 | 31,456 | 28,118 | 32,272 | 32,037 | 30,734 |
| 2023 | 32,087 | 29,097 | 31,833 | 30,063 | 31,958 | 32,233 | 33,065 | 32,046 | 31,220 | 32,764 | 31,996 | 33,973 |
| 2024 | 31,159 | |||||||||||
| - = No Data Reported; -- = Not Applicable; NA = Not Available; W = Withheld to avoid disclosure of individual company data. |
| Release Date: 3/29/2024 |
| Next Release Date: 4/30/2024 |