|
Download Data (XLS File) |
|
||||||||
|
||||||||
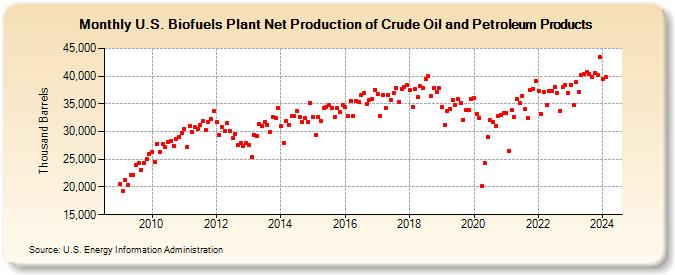
| U.S. Biofuels Plant Net Production of Crude Oil and Petroleum Products (Thousand Barrels) | ||||||||
| Year | Jan | Feb | Mar | Apr | May | Jun | Jul | Aug | Sep | Oct | Nov | Dec |
|---|---|---|---|---|---|---|---|---|---|---|---|---|
| 2009 | 20,546 | 19,199 | 21,195 | 20,432 | 22,143 | 22,231 | 23,950 | 24,262 | 23,125 | 24,332 | 24,982 | 25,969 |
| 2010 | 26,237 | 24,462 | 27,758 | 26,334 | 27,676 | 27,161 | 28,089 | 28,248 | 27,437 | 28,658 | 29,022 | 29,806 |
| 2011 | 30,445 | 27,214 | 31,048 | 29,868 | 30,766 | 30,440 | 31,109 | 31,845 | 30,334 | 31,707 | 32,290 | 33,647 |
| 2012 | 31,679 | 29,391 | 30,731 | 30,071 | 31,515 | 30,086 | 28,775 | 29,586 | 27,606 | 27,936 | 27,398 | 28,013 |
| 2013 | 27,634 | 25,343 | 29,450 | 29,132 | 31,350 | 31,008 | 31,649 | 31,123 | 29,947 | 32,598 | 32,499 | 34,163 |
| 2014 | 31,033 | 28,009 | 31,814 | 31,205 | 32,773 | 32,737 | 33,741 | 32,568 | 31,782 | 32,361 | 31,775 | 35,146 |
| 2015 | 32,708 | 29,342 | 32,615 | 31,955 | 34,321 | 34,430 | 34,845 | 34,194 | 32,712 | 34,218 | 33,513 | 34,837 |
| 2016 | 34,373 | 32,725 | 35,523 | 32,822 | 35,525 | 35,392 | 36,594 | 36,880 | 35,005 | 35,757 | 35,847 | 37,561 |
| 2017 | 36,792 | 32,843 | 36,556 | 34,266 | 36,558 | 35,723 | 36,998 | 37,869 | 35,401 | 37,642 | 38,030 | 38,452 |
| 2018 | 37,512 | 34,381 | 37,621 | 36,157 | 38,137 | 37,790 | 39,457 | 39,970 | 36,408 | 37,805 | 37,212 | 37,893 |
| 2019 | 34,480 | 31,209 | 33,712 | 34,142 | 35,676 | 34,763 | 35,805 | 35,120 | 32,135 | 33,873 | 33,856 | 35,878 |
| 2020 | 35,993 | 33,168 | 32,521 | 20,118 | 24,404 | 29,076 | 32,026 | 31,779 | 31,071 | 32,810 | 32,972 | 33,305 |
| 2021 | 33,272 | 26,526 | 33,936 | 32,582 | 35,937 | 35,102 | 36,488 | 34,124 | 32,379 | 37,455 | 37,688 | 39,167 |
| 2022 | 37,397 | 33,138 | 37,106 | 34,713 | 37,383 | 37,390 | 38,056 | 36,868 | 33,774 | 37,979 | 38,392 | 36,924 |
| 2023 | 38,446 | 34,709 | 38,878 | 37,136 | 40,172 | 40,363 | 40,691 | 40,399 | 39,810 | 40,564 | 40,217 | 43,420 |
| 2024 | 39,440 | |||||||||||
| - = No Data Reported; -- = Not Applicable; NA = Not Available; W = Withheld to avoid disclosure of individual company data. |
| Release Date: 3/29/2024 |
| Next Release Date: 4/30/2024 |