|
Download Data (XLS File) |
|
||||||||
|
||||||||
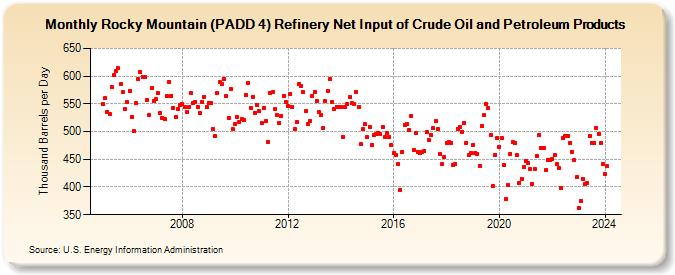
| Rocky Mountain (PADD 4) Refinery Net Input of Crude Oil and Petroleum Products (Thousand Barrels per Day) | ||||||||
| Year | Jan | Feb | Mar | Apr | May | Jun | Jul | Aug | Sep | Oct | Nov | Dec |
|---|---|---|---|---|---|---|---|---|---|---|---|---|
| 2005 | 550 | 560 | 536 | 532 | 581 | 602 | 610 | 614 | 585 | 571 | 541 | 553 |
| 2006 | 574 | 526 | 501 | 551 | 594 | 608 | 599 | 599 | 557 | 530 | 578 | 556 |
| 2007 | 558 | 569 | 533 | 525 | 522 | 564 | 590 | 565 | 543 | 527 | 541 | 548 |
| 2008 | 549 | 545 | 535 | 544 | 569 | 551 | 554 | 545 | 533 | 553 | 563 | 544 |
| 2009 | 552 | 552 | 504 | 492 | 569 | 589 | 586 | 595 | 564 | 525 | 576 | 504 |
| 2010 | 514 | 527 | 517 | 522 | 520 | 566 | 588 | 543 | 563 | 534 | 548 | 537 |
| 2011 | 515 | 543 | 519 | 481 | 569 | 571 | 540 | 530 | 516 | 528 | 565 | 553 |
| 2012 | 546 | 568 | 544 | 504 | 518 | 586 | 582 | 571 | 537 | 513 | 519 | 565 |
| 2013 | 572 | 555 | 535 | 529 | 506 | 555 | 574 | 595 | 554 | 541 | 545 | 544 |
| 2014 | 545 | 491 | 544 | 550 | 562 | 551 | 549 | 571 | 545 | 477 | 504 | 513 |
| 2015 | 490 | 509 | 476 | 493 | 495 | 497 | 495 | 509 | 491 | 497 | 491 | 476 |
| 2016 | 461 | 457 | 442 | 395 | 464 | 512 | 513 | 503 | 528 | 467 | 497 | 464 |
| 2017 | 461 | 463 | 465 | 499 | 485 | 493 | 506 | 519 | 504 | 460 | 441 | 454 |
| 2018 | 479 | 481 | 480 | 440 | 442 | 505 | 508 | 500 | 515 | 480 | 458 | 461 |
| 2019 | 476 | 462 | 460 | 438 | 510 | 529 | 550 | 542 | 494 | 401 | 458 | 488 |
| 2020 | 473 | 488 | 440 | 378 | 403 | 460 | 481 | 480 | 457 | 408 | 415 | 436 |
| 2021 | 446 | 444 | 432 | 406 | 433 | 456 | 494 | 470 | 470 | 430 | 449 | 448 |
| 2022 | 451 | 458 | 441 | 434 | 398 | 488 | 492 | 492 | 480 | 464 | 448 | 418 |
| 2023 | 363 | 374 | 414 | 406 | 407 | 492 | 479 | 480 | 506 | 496 | 480 | 442 |
| 2024 | 423 | 437 | ||||||||||
| - = No Data Reported; -- = Not Applicable; NA = Not Available; W = Withheld to avoid disclosure of individual company data. |
| Release Date: 4/30/2024 |
| Next Release Date: 5/31/2024 |