|
Download Data (XLS File) |
|
||||||||
|
||||||||
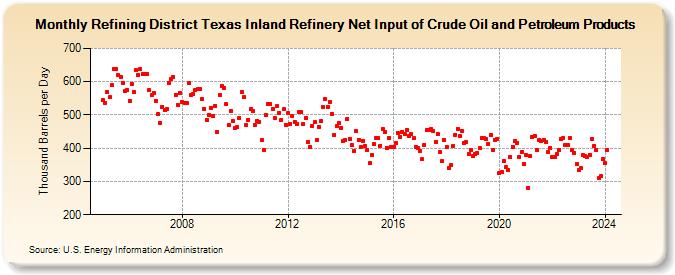
| Refining District Texas Inland Refinery Net Input of Crude Oil and Petroleum Products (Thousand Barrels per Day) | ||||||||
| Year | Jan | Feb | Mar | Apr | May | Jun | Jul | Aug | Sep | Oct | Nov | Dec |
|---|---|---|---|---|---|---|---|---|---|---|---|---|
| 2005 | 544 | 536 | 570 | 553 | 589 | 639 | 639 | 620 | 614 | 597 | 572 | 575 |
| 2006 | 542 | 594 | 569 | 634 | 619 | 638 | 622 | 622 | 624 | 574 | 559 | 567 |
| 2007 | 543 | 503 | 477 | 525 | 514 | 519 | 597 | 608 | 614 | 560 | 530 | 567 |
| 2008 | 540 | 536 | 535 | 596 | 561 | 563 | 576 | 577 | 578 | 548 | 519 | 486 |
| 2009 | 501 | 521 | 498 | 528 | 449 | 560 | 587 | 581 | 532 | 469 | 513 | 481 |
| 2010 | 461 | 463 | 490 | 569 | 554 | 469 | 485 | 517 | 513 | 469 | 481 | 480 |
| 2011 | 426 | 395 | 500 | 533 | 532 | 519 | 490 | 526 | 506 | 484 | 517 | 469 |
| 2012 | 505 | 472 | 498 | 480 | 474 | 509 | 508 | 473 | 492 | 420 | 405 | 466 |
| 2013 | 478 | 425 | 465 | 482 | 525 | 548 | 525 | 540 | 504 | 441 | 466 | 476 |
| 2014 | 462 | 421 | 425 | 489 | 428 | 410 | 393 | 452 | 425 | 404 | 423 | 408 |
| 2015 | 394 | 355 | 380 | 413 | 430 | 430 | 407 | 459 | 448 | 402 | 431 | 403 |
| 2016 | 405 | 415 | 445 | 433 | 449 | 442 | 456 | 438 | 443 | 430 | 405 | 402 |
| 2017 | 391 | 366 | 411 | 455 | 455 | 459 | 452 | 419 | 442 | 389 | 360 | 424 |
| 2018 | 404 | 341 | 349 | 406 | 441 | 459 | 437 | 451 | 416 | 418 | 384 | 395 |
| 2019 | 376 | 384 | 387 | 401 | 431 | 430 | 427 | 413 | 440 | 396 | 426 | 429 |
| 2020 | 326 | 329 | 362 | 342 | 335 | 373 | 404 | 421 | 417 | 374 | 389 | 352 |
| 2021 | 379 | 281 | 376 | 434 | 438 | 395 | 426 | 423 | 424 | 420 | 390 | 401 |
| 2022 | 372 | 374 | 382 | 396 | 428 | 432 | 409 | 409 | 432 | 394 | 385 | 352 |
| 2023 | 334 | 339 | 379 | 376 | 375 | 381 | 427 | 407 | 396 | 311 | 315 | 368 |
| 2024 | 356 | 395 | ||||||||||
| - = No Data Reported; -- = Not Applicable; NA = Not Available; W = Withheld to avoid disclosure of individual company data. |
| Release Date: 4/30/2024 |
| Next Release Date: 5/31/2024 |