|
Download Data (XLS File) |
|
||||||||
|
||||||||
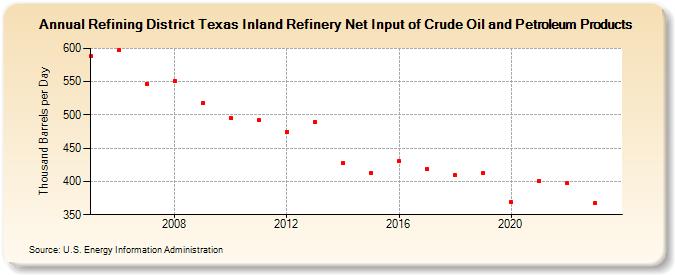
| Refining District Texas Inland Refinery Net Input of Crude Oil and Petroleum Products (Thousand Barrels per Day) | ||||||||
| Decade | Year-0 | Year-1 | Year-2 | Year-3 | Year-4 | Year-5 | Year-6 | Year-7 | Year-8 | Year-9 |
|---|---|---|---|---|---|---|---|---|---|---|
| 2000's | 588 | 597 | 547 | 551 | 518 | |||||
| 2010's | 496 | 492 | 475 | 490 | 428 | 413 | 430 | 419 | 409 | 412 |
| 2020's | 369 | 400 | 397 | 368 |
| - = No Data Reported; -- = Not Applicable; NA = Not Available; W = Withheld to avoid disclosure of individual company data. |
| Release Date: 4/30/2024 |
| Next Release Date: 8/30/2024 |