|
Download Data (XLS File) |
|
||||||||
|
||||||||
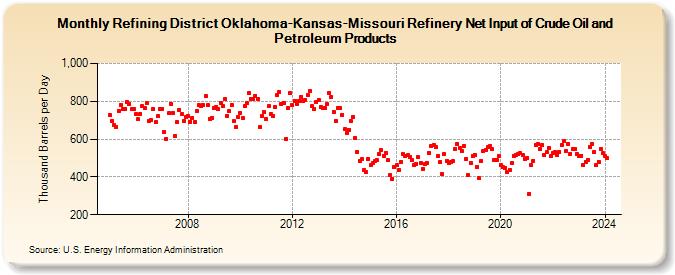
| Refining District Oklahoma-Kansas-Missouri Refinery Net Input of Crude Oil and Petroleum Products (Thousand Barrels per Day) | ||||||||
| Year | Jan | Feb | Mar | Apr | May | Jun | Jul | Aug | Sep | Oct | Nov | Dec |
|---|---|---|---|---|---|---|---|---|---|---|---|---|
| 2005 | 725 | 697 | 673 | 664 | 750 | 781 | 759 | 760 | 796 | 786 | 757 | 760 |
| 2006 | 731 | 704 | 735 | 773 | 764 | 791 | 698 | 700 | 759 | 688 | 721 | 761 |
| 2007 | 761 | 637 | 603 | 736 | 787 | 739 | 619 | 689 | 755 | 732 | 697 | 716 |
| 2008 | 724 | 693 | 714 | 690 | 751 | 778 | 774 | 780 | 827 | 779 | 705 | 714 |
| 2009 | 763 | 771 | 758 | 790 | 774 | 810 | 724 | 747 | 782 | 694 | 663 | 716 |
| 2010 | 737 | 712 | 774 | 790 | 843 | 810 | 812 | 830 | 814 | 662 | 724 | 741 |
| 2011 | 707 | 773 | 732 | 723 | 771 | 834 | 848 | 785 | 793 | 601 | 765 | 844 |
| 2012 | 778 | 804 | 788 | 803 | 825 | 799 | 808 | 833 | 854 | 774 | 760 | 798 |
| 2013 | 806 | 772 | 767 | 763 | 785 | 844 | 823 | 745 | 698 | 766 | 762 | 729 |
| 2014 | 652 | 632 | 650 | 696 | 718 | 605 | 534 | 483 | 493 | 436 | 427 | 494 |
| 2015 | 462 | 474 | 482 | 488 | 522 | 540 | 512 | 529 | 489 | 410 | 391 | 455 |
| 2016 | 462 | 437 | 481 | 519 | 510 | 514 | 507 | 487 | 464 | 469 | 505 | 471 |
| 2017 | 443 | 466 | 476 | 528 | 564 | 570 | 557 | 510 | 480 | 415 | 520 | 485 |
| 2018 | 472 | 481 | 482 | 548 | 575 | 553 | 536 | 565 | 495 | 408 | 475 | 510 |
| 2019 | 518 | 455 | 392 | 485 | 536 | 544 | 558 | 563 | 545 | 490 | 490 | 510 |
| 2020 | 465 | 451 | 448 | 427 | 439 | 471 | 511 | 516 | 519 | 526 | 515 | 497 |
| 2021 | 502 | 311 | 463 | 486 | 569 | 573 | 549 | 569 | 515 | 531 | 552 | 510 |
| 2022 | 528 | 531 | 514 | 534 | 568 | 589 | 537 | 576 | 522 | 545 | 545 | 523 |
| 2023 | 512 | 513 | 465 | 481 | 491 | 560 | 576 | 531 | 464 | 479 | 548 | 524 |
| 2024 | 509 | 498 | ||||||||||
| - = No Data Reported; -- = Not Applicable; NA = Not Available; W = Withheld to avoid disclosure of individual company data. |
| Release Date: 4/30/2024 |
| Next Release Date: 5/31/2024 |