|
Download Data (XLS File) |
|
||||||||
|
||||||||
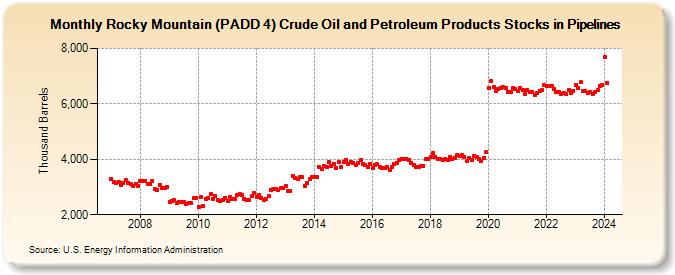
| Rocky Mountain (PADD 4) Crude Oil and Petroleum Products Stocks in Pipelines (Thousand Barrels) | ||||||||
| Year | Jan | Feb | Mar | Apr | May | Jun | Jul | Aug | Sep | Oct | Nov | Dec |
|---|---|---|---|---|---|---|---|---|---|---|---|---|
| 2007 | 3,292 | 3,173 | 3,153 | 3,190 | 3,074 | 3,140 | 3,252 | 3,130 | 3,114 | 3,051 | 3,126 | 3,034 |
| 2008 | 3,212 | 3,233 | 3,231 | 3,108 | 3,110 | 3,225 | 2,936 | 2,885 | 3,071 | 2,954 | 2,962 | 3,006 |
| 2009 | 2,471 | 2,512 | 2,523 | 2,408 | 2,473 | 2,451 | 2,447 | 2,402 | 2,440 | 2,419 | 2,600 | 2,595 |
| 2010 | 2,286 | 2,630 | 2,313 | 2,571 | 2,602 | 2,739 | 2,581 | 2,669 | 2,523 | 2,500 | 2,521 | 2,605 |
| 2011 | 2,492 | 2,641 | 2,559 | 2,556 | 2,697 | 2,753 | 2,718 | 2,580 | 2,513 | 2,517 | 2,687 | 2,779 |
| 2012 | 2,638 | 2,711 | 2,614 | 2,517 | 2,565 | 2,665 | 2,889 | 2,918 | 2,920 | 2,896 | 2,947 | 2,969 |
| 2013 | 3,044 | 2,841 | 2,865 | 3,410 | 3,338 | 3,292 | 3,368 | 3,368 | 3,042 | 3,128 | 3,281 | 3,377 |
| 2014 | 3,363 | 3,375 | 3,726 | 3,634 | 3,760 | 3,709 | 3,897 | 3,755 | 3,832 | 3,672 | 3,908 | 3,709 |
| 2015 | 3,913 | 3,962 | 3,841 | 3,912 | 3,851 | 3,808 | 3,863 | 3,965 | 3,841 | 3,783 | 3,721 | 3,843 |
| 2016 | 3,689 | 3,781 | 3,818 | 3,706 | 3,670 | 3,693 | 3,708 | 3,630 | 3,714 | 3,847 | 3,880 | 3,959 |
| 2017 | 4,021 | 4,011 | 4,024 | 3,958 | 3,874 | 3,791 | 3,715 | 3,715 | 3,740 | 3,769 | 4,000 | 4,025 |
| 2018 | 4,078 | 4,224 | 4,064 | 4,006 | 4,000 | 3,972 | 4,013 | 3,979 | 4,093 | 4,018 | 4,059 | 4,150 |
| 2019 | 4,101 | 4,150 | 4,089 | 3,953 | 4,050 | 3,990 | 4,134 | 4,099 | 4,023 | 3,941 | 4,047 | 4,257 |
| 2020 | 6,589 | 6,840 | 6,594 | 6,473 | 6,529 | 6,555 | 6,609 | 6,571 | 6,426 | 6,428 | 6,560 | 6,539 |
| 2021 | 6,467 | 6,565 | 6,494 | 6,357 | 6,516 | 6,411 | 6,431 | 6,323 | 6,404 | 6,467 | 6,487 | 6,668 |
| 2022 | 6,638 | 6,655 | 6,640 | 6,538 | 6,439 | 6,434 | 6,364 | 6,402 | 6,339 | 6,515 | 6,386 | 6,476 |
| 2023 | 6,693 | 6,578 | 6,770 | 6,455 | 6,468 | 6,391 | 6,422 | 6,370 | 6,428 | 6,491 | 6,653 | 6,680 |
| 2024 | 7,675 | |||||||||||
| - = No Data Reported; -- = Not Applicable; NA = Not Available; W = Withheld to avoid disclosure of individual company data. |
| Release Date: 3/29/2024 |
| Next Release Date: 4/30/2024 |