|
Download Data (XLS File) |
|
||||||||
|
||||||||
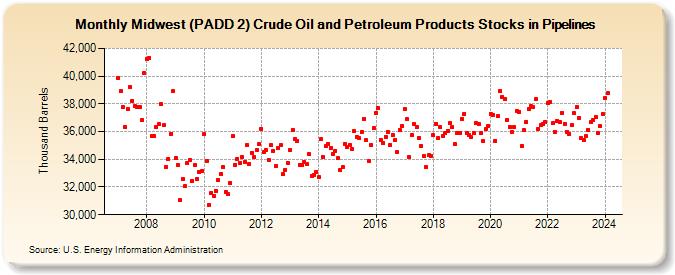
| Midwest (PADD 2) Crude Oil and Petroleum Products Stocks in Pipelines (Thousand Barrels) | ||||||||
| Year | Jan | Feb | Mar | Apr | May | Jun | Jul | Aug | Sep | Oct | Nov | Dec |
|---|---|---|---|---|---|---|---|---|---|---|---|---|
| 2007 | 39,898 | 38,898 | 37,760 | 36,324 | 37,619 | 39,216 | 38,226 | 37,837 | 37,798 | 37,781 | 36,840 | 40,234 |
| 2008 | 41,229 | 41,337 | 35,650 | 35,662 | 36,348 | 36,536 | 37,964 | 36,437 | 33,454 | 34,046 | 35,843 | 38,907 |
| 2009 | 34,063 | 33,595 | 31,048 | 32,590 | 32,037 | 33,731 | 33,930 | 32,443 | 33,583 | 32,607 | 33,048 | 33,144 |
| 2010 | 35,800 | 33,895 | 30,715 | 31,566 | 31,365 | 31,711 | 32,511 | 32,956 | 33,425 | 31,665 | 31,464 | 32,280 |
| 2011 | 35,668 | 33,619 | 34,049 | 33,757 | 34,159 | 33,800 | 35,034 | 33,645 | 34,480 | 34,163 | 34,667 | 35,076 |
| 2012 | 36,211 | 34,552 | 34,698 | 33,965 | 35,016 | 34,616 | 33,508 | 34,845 | 34,996 | 32,908 | 33,249 | 33,745 |
| 2013 | 34,669 | 36,136 | 35,436 | 35,330 | 33,614 | 33,554 | 33,809 | 33,635 | 34,353 | 32,789 | 32,887 | 33,109 |
| 2014 | 32,702 | 35,437 | 34,149 | 34,930 | 35,105 | 34,824 | 34,391 | 34,631 | 34,057 | 33,224 | 33,410 | 35,120 |
| 2015 | 34,863 | 35,040 | 34,712 | 36,031 | 35,636 | 35,524 | 35,954 | 36,930 | 35,363 | 33,905 | 35,047 | 36,273 |
| 2016 | 37,358 | 37,717 | 35,402 | 35,169 | 35,629 | 35,980 | 35,028 | 35,786 | 35,421 | 34,495 | 36,096 | 36,434 |
| 2017 | 37,616 | 36,895 | 34,132 | 35,761 | 36,551 | 36,311 | 35,527 | 34,945 | 34,224 | 33,438 | 34,273 | 34,267 |
| 2018 | 35,716 | 36,548 | 35,502 | 36,300 | 35,670 | 35,886 | 36,066 | 36,585 | 36,302 | 35,086 | 35,926 | 35,887 |
| 2019 | 36,907 | 37,285 | 35,908 | 35,724 | 35,576 | 35,885 | 36,622 | 36,531 | 35,869 | 35,297 | 36,149 | 36,407 |
| 2020 | 37,302 | 37,216 | 35,345 | 37,108 | 38,945 | 38,504 | 38,359 | 36,867 | 36,317 | 35,956 | 36,323 | 37,506 |
| 2021 | 37,443 | 34,988 | 36,093 | 36,710 | 37,635 | 37,831 | 37,744 | 38,324 | 36,204 | 36,454 | 36,571 | 36,682 |
| 2022 | 38,078 | 38,126 | 36,600 | 35,996 | 36,756 | 36,654 | 37,368 | 36,567 | 35,996 | 35,822 | 36,457 | 37,309 |
| 2023 | 37,973 | 37,156 | 35,715 | 35,475 | 35,576 | 35,966 | 36,518 | 36,674 | 36,859 | 36,134 | 36,414 | 37,531 |
| 2024 | 38,403 | 38,751 | 35,835 | 36,674 | 34,151 | 38,181 | ||||||
| - = No Data Reported; -- = Not Applicable; NA = Not Available; W = Withheld to avoid disclosure of individual company data. |
| Release Date: 8/30/2024 |
| Next Release Date: 9/30/2024 |