|
Download Data (XLS File) |
|
||||||||
|
||||||||
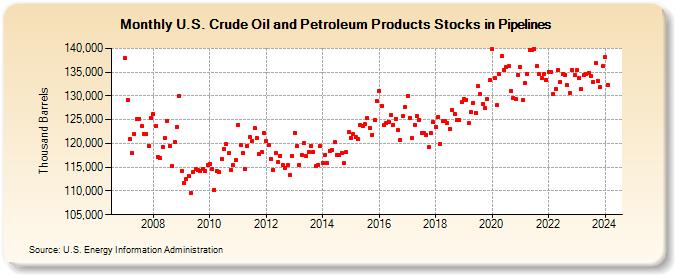
| U.S. Crude Oil and Petroleum Products Stocks in Pipelines (Thousand Barrels) | ||||||||
| Year | Jan | Feb | Mar | Apr | May | Jun | Jul | Aug | Sep | Oct | Nov | Dec |
|---|---|---|---|---|---|---|---|---|---|---|---|---|
| 2007 | 137,920 | 129,096 | 120,874 | 117,967 | 121,995 | 125,167 | 125,222 | 123,770 | 122,009 | 121,891 | 119,525 | 125,403 |
| 2008 | 126,178 | 123,638 | 117,135 | 116,864 | 119,306 | 121,168 | 124,808 | 119,528 | 115,193 | 120,393 | 123,505 | 130,073 |
| 2009 | 114,262 | 111,583 | 112,438 | 113,225 | 109,479 | 113,941 | 114,646 | 114,364 | 114,220 | 114,553 | 114,294 | 115,483 |
| 2010 | 115,767 | 114,687 | 110,255 | 114,198 | 113,952 | 116,796 | 118,788 | 119,917 | 117,888 | 114,457 | 115,505 | 116,509 |
| 2011 | 123,838 | 119,594 | 117,888 | 114,519 | 119,525 | 121,291 | 120,512 | 123,145 | 121,180 | 117,881 | 118,092 | 122,163 |
| 2012 | 120,483 | 119,616 | 116,711 | 114,508 | 118,019 | 116,070 | 117,426 | 115,512 | 114,935 | 115,372 | 113,394 | 117,366 |
| 2013 | 122,213 | 119,440 | 115,534 | 117,656 | 119,996 | 117,251 | 118,285 | 119,552 | 118,281 | 115,262 | 115,473 | 119,376 |
| 2014 | 115,977 | 117,621 | 115,790 | 118,404 | 118,636 | 120,227 | 117,598 | 117,530 | 118,057 | 115,796 | 118,156 | 122,305 |
| 2015 | 121,215 | 121,945 | 121,274 | 120,869 | 123,907 | 123,772 | 124,047 | 125,401 | 123,341 | 121,823 | 125,006 | 128,830 |
| 2016 | 131,109 | 127,885 | 123,802 | 124,338 | 124,600 | 125,885 | 123,886 | 125,204 | 122,864 | 120,707 | 125,833 | 127,693 |
| 2017 | 129,975 | 125,386 | 121,067 | 123,940 | 125,771 | 125,014 | 122,258 | 122,160 | 121,845 | 119,158 | 122,176 | 124,428 |
| 2018 | 123,520 | 125,606 | 119,943 | 124,627 | 124,734 | 124,279 | 123,072 | 127,108 | 126,251 | 124,944 | 124,926 | 128,694 |
| 2019 | 129,378 | 129,132 | 124,210 | 126,708 | 128,571 | 126,387 | 132,080 | 130,384 | 128,359 | 127,356 | 129,421 | 133,275 |
| 2020 | 139,814 | 133,720 | 128,012 | 134,530 | 138,322 | 135,516 | 136,013 | 136,228 | 131,043 | 129,623 | 129,258 | 134,484 |
| 2021 | 136,005 | 129,130 | 132,713 | 134,667 | 139,717 | 139,623 | 139,939 | 136,266 | 134,563 | 133,843 | 134,646 | 133,432 |
| 2022 | 135,084 | 135,050 | 130,388 | 131,470 | 135,376 | 132,918 | 134,623 | 134,447 | 132,206 | 130,662 | 135,514 | 134,312 |
| 2023 | 135,395 | 133,740 | 131,389 | 134,310 | 134,628 | 134,873 | 134,142 | 133,029 | 136,825 | 133,232 | 131,806 | 136,201 |
| 2024 | 138,117 | |||||||||||
| - = No Data Reported; -- = Not Applicable; NA = Not Available; W = Withheld to avoid disclosure of individual company data. |
| Release Date: 3/29/2024 |
| Next Release Date: 4/30/2024 |