|
Download Data (XLS File) |
|
||||||||
|
||||||||
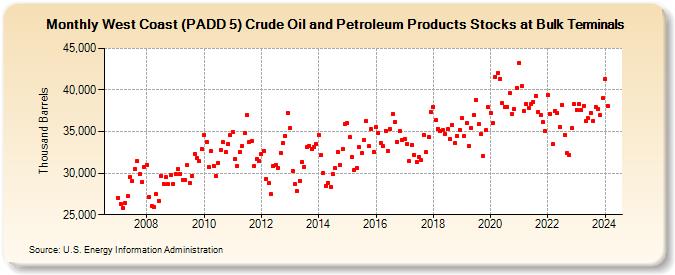
| West Coast (PADD 5) Crude Oil and Petroleum Products Stocks at Bulk Terminals (Thousand Barrels) | ||||||||
| Year | Jan | Feb | Mar | Apr | May | Jun | Jul | Aug | Sep | Oct | Nov | Dec |
|---|---|---|---|---|---|---|---|---|---|---|---|---|
| 2007 | 27,045 | 26,290 | 25,833 | 26,446 | 27,207 | 29,484 | 29,035 | 30,459 | 31,443 | 29,876 | 28,946 | 30,770 |
| 2008 | 31,009 | 27,185 | 26,092 | 25,985 | 27,462 | 26,702 | 29,621 | 28,733 | 29,483 | 28,638 | 29,824 | 28,749 |
| 2009 | 29,921 | 30,490 | 29,939 | 29,186 | 29,177 | 30,931 | 28,785 | 29,715 | 32,321 | 31,793 | 31,414 | 32,877 |
| 2010 | 34,645 | 33,788 | 30,795 | 32,629 | 30,887 | 29,625 | 31,261 | 32,725 | 33,685 | 32,504 | 33,504 | 34,608 |
| 2011 | 34,964 | 31,674 | 30,877 | 32,565 | 33,282 | 34,813 | 36,971 | 33,788 | 33,903 | 30,882 | 31,725 | 31,507 |
| 2012 | 32,304 | 32,677 | 29,329 | 28,790 | 27,459 | 30,811 | 31,010 | 30,627 | 32,473 | 33,623 | 34,437 | 37,285 |
| 2013 | 35,404 | 30,276 | 28,649 | 27,848 | 29,073 | 31,329 | 30,720 | 33,118 | 33,272 | 32,953 | 33,168 | 33,478 |
| 2014 | 34,558 | 32,162 | 29,996 | 28,512 | 28,867 | 28,311 | 29,867 | 30,604 | 32,551 | 30,964 | 32,851 | 35,880 |
| 2015 | 36,011 | 34,301 | 31,970 | 30,366 | 30,621 | 33,106 | 32,372 | 33,945 | 36,288 | 33,203 | 35,326 | 32,567 |
| 2016 | 35,517 | 34,859 | 33,636 | 33,212 | 35,071 | 32,710 | 35,283 | 37,112 | 36,152 | 33,784 | 35,016 | 33,956 |
| 2017 | 34,095 | 33,560 | 31,432 | 33,429 | 32,238 | 31,385 | 31,979 | 31,542 | 34,639 | 32,510 | 34,335 | 37,378 |
| 2018 | 38,009 | 36,386 | 35,307 | 35,013 | 35,156 | 34,748 | 35,299 | 34,089 | 35,756 | 33,613 | 34,483 | 35,194 |
| 2019 | 36,606 | 34,476 | 36,062 | 33,273 | 35,479 | 37,001 | 38,844 | 35,906 | 34,667 | 32,019 | 35,149 | 37,908 |
| 2020 | 37,271 | 35,991 | 41,611 | 42,036 | 41,368 | 38,374 | 37,929 | 37,950 | 39,650 | 37,160 | 37,705 | 40,252 |
| 2021 | 43,290 | 40,456 | 37,486 | 38,313 | 37,875 | 38,282 | 38,587 | 39,285 | 37,403 | 36,958 | 36,112 | 35,059 |
| 2022 | 39,432 | 37,108 | 33,450 | 37,529 | 37,201 | 35,505 | 38,241 | 34,622 | 32,395 | 32,206 | 35,374 | 38,279 |
| 2023 | 37,633 | 38,259 | 37,611 | 38,123 | 36,283 | 36,578 | 37,265 | 36,295 | 37,961 | 37,712 | 36,940 | 38,980 |
| 2024 | 41,312 | |||||||||||
| - = No Data Reported; -- = Not Applicable; NA = Not Available; W = Withheld to avoid disclosure of individual company data. |
| Release Date: 3/29/2024 |
| Next Release Date: 4/30/2024 |