|
Download Data (XLS File) |
|
||||||||
|
||||||||
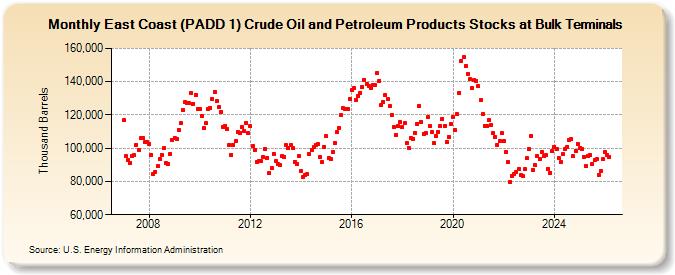
| East Coast (PADD 1) Crude Oil and Petroleum Products Stocks at Bulk Terminals (Thousand Barrels) | ||||||||
| Year | Jan | Feb | Mar | Apr | May | Jun | Jul | Aug | Sep | Oct | Nov | Dec |
|---|---|---|---|---|---|---|---|---|---|---|---|---|
| 2007 | 116,678 | 95,148 | 92,720 | 91,159 | 95,144 | 95,686 | 102,202 | 99,006 | 105,979 | 106,123 | 103,447 | 103,519 |
| 2008 | 102,792 | 96,028 | 84,376 | 85,914 | 89,382 | 93,634 | 95,919 | 99,896 | 91,091 | 90,541 | 96,509 | 105,209 |
| 2009 | 106,247 | 105,783 | 110,933 | 114,930 | 123,018 | 127,498 | 126,987 | 127,085 | 133,212 | 126,802 | 132,179 | 123,371 |
| 2010 | 123,350 | 119,602 | 112,064 | 114,898 | 123,767 | 124,250 | 129,433 | 133,996 | 128,342 | 124,498 | 121,985 | 112,638 |
| 2011 | 113,461 | 111,567 | 102,080 | 96,041 | 102,145 | 104,020 | 109,648 | 109,065 | 112,635 | 110,172 | 115,290 | 109,173 |
| 2012 | 113,165 | 101,290 | 98,624 | 91,778 | 92,339 | 92,076 | 94,407 | 99,731 | 94,281 | 84,866 | 87,878 | 96,773 |
| 2013 | 92,102 | 90,376 | 89,727 | 95,232 | 94,867 | 101,738 | 99,952 | 101,655 | 99,973 | 91,921 | 90,222 | 95,344 |
| 2014 | 86,524 | 82,738 | 83,900 | 84,346 | 96,437 | 99,001 | 100,554 | 101,938 | 102,226 | 94,638 | 91,788 | 100,973 |
| 2015 | 107,247 | 94,281 | 93,614 | 97,901 | 103,396 | 109,464 | 112,372 | 119,786 | 123,956 | 123,645 | 123,554 | 129,814 |
| 2016 | 135,109 | 136,059 | 128,707 | 131,537 | 133,441 | 136,986 | 141,145 | 138,550 | 137,571 | 136,121 | 138,179 | 137,861 |
| 2017 | 145,381 | 140,578 | 125,955 | 127,936 | 131,871 | 129,334 | 125,279 | 120,070 | 112,708 | 107,980 | 113,228 | 115,697 |
| 2018 | 112,734 | 114,949 | 103,181 | 100,290 | 106,241 | 105,678 | 109,399 | 114,737 | 125,239 | 115,598 | 108,551 | 108,836 |
| 2019 | 118,857 | 113,484 | 109,534 | 103,027 | 107,248 | 109,944 | 113,199 | 117,616 | 113,521 | 103,829 | 106,973 | 114,818 |
| 2020 | 118,744 | 110,891 | 120,359 | 133,385 | 152,559 | 154,788 | 149,573 | 144,743 | 141,342 | 136,213 | 140,996 | 140,646 |
| 2021 | 137,224 | 128,909 | 120,383 | 113,240 | 113,154 | 116,934 | 113,814 | 109,118 | 106,685 | 102,069 | 104,376 | 108,901 |
| 2022 | 104,103 | 97,711 | 91,435 | 79,750 | 83,560 | 84,520 | 85,873 | 87,488 | 83,714 | 83,128 | 87,468 | 93,901 |
| 2023 | 99,410 | 107,116 | 87,184 | 89,102 | 94,379 | 93,497 | 98,059 | 95,329 | 95,649 | 87,677 | 85,148 | 98,057 |
| 2024 | 101,054 | |||||||||||
| - = No Data Reported; -- = Not Applicable; NA = Not Available; W = Withheld to avoid disclosure of individual company data. |
| Release Date: 3/29/2024 |
| Next Release Date: 4/30/2024 |