|
Download Data (XLS File) |
|
||||||||
|
||||||||
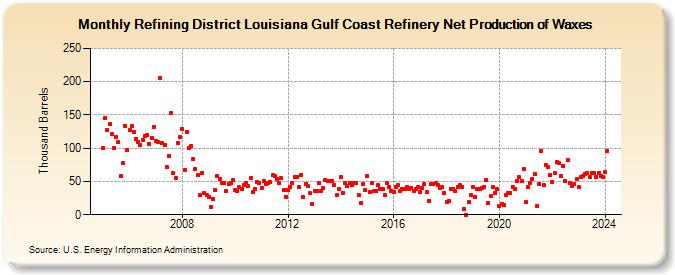
| Refining District Louisiana Gulf Coast Refinery Net Production of Waxes (Thousand Barrels) | ||||||||
| Year | Jan | Feb | Mar | Apr | May | Jun | Jul | Aug | Sep | Oct | Nov | Dec |
|---|---|---|---|---|---|---|---|---|---|---|---|---|
| 2005 | 100 | 146 | 127 | 137 | 121 | 101 | 117 | 109 | 58 | 78 | 133 | 97 |
| 2006 | 127 | 134 | 124 | 114 | 110 | 105 | 113 | 118 | 120 | 107 | 115 | 132 |
| 2007 | 111 | 109 | 206 | 108 | 105 | 71 | 89 | 153 | 62 | 55 | 108 | 117 |
| 2008 | 129 | 67 | 125 | 101 | 103 | 83 | 69 | 59 | 29 | 62 | 33 | 29 |
| 2009 | 26 | 11 | 24 | 37 | 58 | 54 | 48 | 48 | 36 | 46 | 47 | 52 |
| 2010 | 37 | 36 | 41 | 39 | 45 | 47 | 43 | 55 | 34 | 39 | 49 | 48 |
| 2011 | 40 | 51 | 46 | 48 | 49 | 59 | 58 | 53 | 47 | 55 | 37 | 27 |
| 2012 | 37 | 42 | 48 | 57 | 57 | 42 | 60 | 26 | 46 | 43 | 32 | 16 |
| 2013 | 35 | 35 | 47 | 36 | 40 | 52 | 50 | 51 | 51 | 45 | 29 | 39 |
| 2014 | 56 | 33 | 47 | 43 | 47 | 45 | 47 | 48 | 30 | 17 | 46 | 37 |
| 2015 | 58 | 34 | 47 | 35 | 35 | 44 | 39 | 39 | 29 | 48 | 41 | 36 |
| 2016 | 34 | 42 | 44 | 35 | 39 | 39 | 42 | 38 | 40 | 36 | 39 | 41 |
| 2017 | 34 | 40 | 46 | 34 | 21 | 46 | 46 | 47 | 45 | 40 | 41 | 33 |
| 2018 | 19 | 21 | 39 | 39 | 35 | 42 | 44 | 41 | 8 | 0 | 19 | 30 |
| 2019 | 42 | 27 | 39 | 39 | 40 | 42 | 52 | 18 | 28 | 42 | 33 | 38 |
| 2020 | 13 | 16 | 15 | 29 | 33 | 32 | 42 | 39 | 50 | 56 | 50 | 68 |
| 2021 | 19 | 41 | 48 | 53 | 61 | 13 | 46 | 96 | 45 | 75 | 71 | 60 |
| 2022 | 49 | 62 | 79 | 77 | 58 | 73 | 51 | 82 | 48 | 43 | 46 | 54 |
| 2023 | 42 | 56 | 58 | 61 | 62 | 56 | 63 | 63 | 57 | 62 | 58 | 56 |
| 2024 | 64 | |||||||||||
| - = No Data Reported; -- = Not Applicable; NA = Not Available; W = Withheld to avoid disclosure of individual company data. |
| Release Date: 3/29/2024 |
| Next Release Date: 4/30/2024 |