|
Download Data (XLS File) |
|
||||||||
|
||||||||
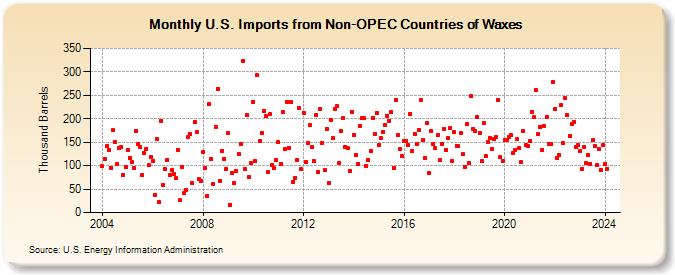
| U.S. Imports from Non-OPEC Countries of Waxes (Thousand Barrels) | ||||||||
| Year | Jan | Feb | Mar | Apr | May | Jun | Jul | Aug | Sep | Oct | Nov | Dec |
|---|---|---|---|---|---|---|---|---|---|---|---|---|
| 2004 | 99 | 114 | 141 | 134 | 96 | 175 | 151 | 104 | 138 | 140 | 81 | 97 |
| 2005 | 134 | 116 | 107 | 94 | 173 | 147 | 139 | 80 | 126 | 136 | 101 | 118 |
| 2006 | 109 | 38 | 157 | 22 | 196 | 59 | 92 | 113 | 80 | 91 | 83 | 73 |
| 2007 | 133 | 26 | 98 | 41 | 48 | 162 | 168 | 62 | 194 | 171 | 71 | 68 |
| 2008 | 129 | 96 | 36 | 231 | 114 | 61 | 183 | 264 | 68 | 132 | 115 | 93 |
| 2009 | 169 | 17 | 84 | 64 | 88 | 125 | 146 | 324 | 92 | 207 | 76 | 105 |
| 2010 | 236 | 110 | 293 | 153 | 170 | 216 | 206 | 87 | 210 | 101 | 94 | 111 |
| 2011 | 150 | 104 | 214 | 135 | 236 | 138 | 236 | 66 | 74 | 111 | 222 | 93 |
| 2012 | 213 | 108 | 149 | 186 | 139 | 109 | 208 | 86 | 221 | 149 | 90 | 179 |
| 2013 | 64 | 198 | 160 | 221 | 227 | 106 | 173 | 201 | 140 | 137 | 89 | 215 |
| 2014 | 166 | 123 | 104 | 185 | 201 | 201 | 100 | 113 | 131 | 202 | 168 | 213 |
| 2015 | 144 | 158 | 171 | 186 | 206 | 196 | 214 | 96 | 241 | 165 | 135 | 121 |
| 2016 | 152 | 153 | 144 | 211 | 132 | 168 | 146 | 176 | 239 | 154 | 116 | 190 |
| 2017 | 84 | 173 | 146 | 137 | 165 | 112 | 147 | 178 | 133 | 159 | 180 | 110 |
| 2018 | 171 | 142 | 141 | 169 | 124 | 98 | 188 | 106 | 248 | 179 | 173 | 204 |
| 2019 | 170 | 109 | 192 | 120 | 150 | 159 | 136 | 156 | 161 | 240 | 119 | 110 |
| 2020 | 155 | 155 | 162 | 165 | 126 | 134 | 157 | 138 | 107 | 173 | 144 | 141 |
| 2021 | 152 | 215 | 203 | 262 | 168 | 182 | 133 | 184 | 204 | 147 | 146 | 278 |
| 2022 | 221 | 116 | 122 | 229 | 149 | 244 | 207 | 164 | 188 | 194 | 140 | 143 |
| 2023 | 131 | 93 | 140 | 106 | 123 | 104 | 154 | 142 | 102 | 135 | 90 | 143 |
| 2024 | 104 | |||||||||||
| - = No Data Reported; -- = Not Applicable; NA = Not Available; W = Withheld to avoid disclosure of individual company data. |
| Release Date: 3/29/2024 |
| Next Release Date: 4/30/2024 |
Referring Pages: