|
Download Data (XLS File) |
|
||||||||
|
||||||||
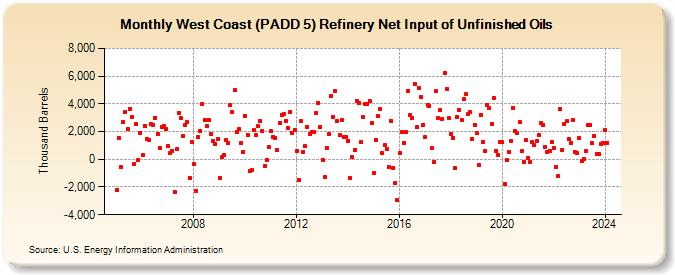
| West Coast (PADD 5) Refinery Net Input of Unfinished Oils (Thousand Barrels) | ||||||||
| Year | Jan | Feb | Mar | Apr | May | Jun | Jul | Aug | Sep | Oct | Nov | Dec |
|---|---|---|---|---|---|---|---|---|---|---|---|---|
| 2005 | -2,186 | 1,526 | -548 | 2,705 | 3,383 | 2,165 | 3,652 | 3,048 | -363 | 2,525 | -39 | 1,897 |
| 2006 | 299 | 2,416 | 1,493 | 1,401 | 2,542 | 2,492 | 3,004 | 1,848 | 810 | 2,345 | 2,415 | 2,189 |
| 2007 | 937 | 419 | 626 | -2,356 | 709 | 3,367 | 3,003 | 1,712 | 2,498 | 2,673 | -1,323 | 1,256 |
| 2008 | -345 | -2,283 | 1,577 | 2,039 | 4,001 | 2,828 | 2,402 | 2,849 | 1,838 | 1,299 | 1,114 | 1,450 |
| 2009 | -1,360 | 130 | 342 | 1,358 | 1,144 | 3,882 | 3,433 | 4,995 | 1,958 | 2,183 | 1,193 | 552 |
| 2010 | 3,116 | 1,772 | -875 | -792 | 2,102 | 1,739 | 2,368 | 2,754 | 2,040 | -492 | -63 | 911 |
| 2011 | 2,051 | 1,609 | 1,566 | 697 | 2,617 | 3,213 | 3,231 | 2,770 | 2,245 | 3,437 | 1,922 | 2,134 |
| 2012 | 631 | -1,460 | 2,751 | 546 | 938 | 2,348 | 1,819 | 1,988 | 1,981 | 3,338 | 4,072 | 2,349 |
| 2013 | -17 | -1,310 | 834 | 1,790 | 4,570 | 3,069 | 4,914 | 2,763 | 1,741 | 2,865 | 1,602 | 1,627 |
| 2014 | 1,308 | -1,373 | 129 | 671 | 4,224 | 4,079 | 1,232 | 3,060 | 4,022 | 4,002 | 4,228 | 2,647 |
| 2015 | -990 | 1,415 | 3,092 | 3,632 | 437 | 996 | 728 | -542 | 2,791 | -616 | -1,701 | -2,972 |
| 2016 | 436 | 1,943 | 1,170 | 1,939 | 4,952 | 3,184 | 3,008 | 5,430 | 2,300 | 5,138 | 4,526 | 2,473 |
| 2017 | 1,584 | 3,927 | 3,846 | 797 | -161 | 4,892 | 2,949 | 3,591 | 2,925 | 6,197 | 5,101 | 2,945 |
| 2018 | 1,789 | 1,557 | -662 | 3,083 | 3,579 | 2,859 | 4,321 | 4,680 | 3,251 | 3,379 | 1,483 | 2,501 |
| 2019 | 1,862 | -416 | 3,223 | 1,226 | 606 | 3,903 | 3,724 | 2,557 | 4,412 | 613 | 321 | 1,228 |
| 2020 | 1,213 | -1,801 | -76 | 503 | 1,318 | 3,684 | 2,006 | 1,899 | 2,673 | 564 | -220 | 1,375 |
| 2021 | 76 | -217 | 1,253 | 1,009 | 1,292 | 1,735 | 2,617 | 2,502 | 896 | 548 | 612 | 1,222 |
| 2022 | 843 | -534 | -1,240 | 3,634 | 686 | 2,568 | 2,729 | 1,460 | 1,152 | 2,818 | 533 | 420 |
| 2023 | 1,548 | -107 | 7 | 622 | 2,444 | 2,482 | 1,152 | 1,701 | 385 | 388 | 1,098 | 1,181 |
| 2024 | 2,125 | |||||||||||
| - = No Data Reported; -- = Not Applicable; NA = Not Available; W = Withheld to avoid disclosure of individual company data. |
| Release Date: 3/29/2024 |
| Next Release Date: 4/30/2024 |
Referring Pages: