|
Download Data (XLS File) |
|
||||||||
|
||||||||
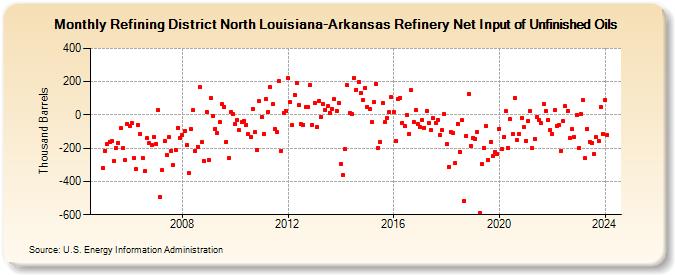
| Refining District North Louisiana-Arkansas Refinery Net Input of Unfinished Oils (Thousand Barrels) | ||||||||
| Year | Jan | Feb | Mar | Apr | May | Jun | Jul | Aug | Sep | Oct | Nov | Dec |
|---|---|---|---|---|---|---|---|---|---|---|---|---|
| 2005 | -319 | -214 | -175 | -162 | -158 | -278 | -200 | -168 | -81 | -199 | -272 | -53 |
| 2006 | -65 | -48 | -259 | -324 | -60 | -112 | -258 | -340 | -141 | -171 | -179 | -130 |
| 2007 | -173 | 29 | -491 | -334 | -159 | -238 | -133 | -215 | -304 | -212 | -77 | -138 |
| 2008 | -121 | -97 | -183 | -350 | -85 | 28 | -217 | -191 | 166 | -165 | -278 | 18 |
| 2009 | -269 | 100 | -5 | -83 | -110 | -44 | 65 | 50 | -160 | -261 | 20 | 6 |
| 2010 | -53 | -32 | -93 | -45 | -36 | -59 | -117 | -132 | 38 | -104 | -209 | 82 |
| 2011 | -11 | -113 | 95 | 19 | 168 | 64 | -84 | -100 | 203 | -216 | 13 | 24 |
| 2012 | 220 | 77 | -61 | 122 | 193 | 59 | -55 | -58 | 47 | 45 | 181 | -59 |
| 2013 | 74 | -75 | 84 | -14 | 67 | 31 | 51 | 13 | 35 | 94 | 26 | 72 |
| 2014 | -294 | -362 | -205 | 177 | 12 | 6 | 223 | 152 | 197 | 133 | 90 | 164 |
| 2015 | 48 | 35 | -45 | 77 | 187 | -197 | -161 | 69 | -43 | -16 | 15 | 109 |
| 2016 | 18 | -154 | 98 | 104 | -48 | -69 | 2 | -113 | 147 | -40 | 27 | -57 |
| 2017 | -72 | -31 | -76 | 26 | -46 | -93 | -20 | -47 | -30 | -118 | -91 | 4 |
| 2018 | -174 | -312 | -103 | -106 | -292 | -54 | -220 | -33 | -516 | -124 | 123 | -185 |
| 2019 | -136 | -143 | -103 | -590 | -296 | -196 | -66 | -269 | -164 | -248 | -222 | -232 |
| 2020 | -83 | -207 | -131 | 22 | -197 | -27 | -114 | 102 | -148 | -113 | -18 | -75 |
| 2021 | -155 | -34 | 23 | -201 | -142 | -13 | -31 | -51 | 67 | 25 | -30 | -89 |
| 2022 | -114 | 28 | -66 | -63 | -217 | -39 | 51 | 23 | -139 | -86 | -132 | -1 |
| 2023 | -200 | 5 | 87 | -261 | -82 | -160 | -167 | -233 | -132 | -158 | 46 | -112 |
| 2024 | 91 | -120 | ||||||||||
| - = No Data Reported; -- = Not Applicable; NA = Not Available; W = Withheld to avoid disclosure of individual company data. |
| Release Date: 4/30/2024 |
| Next Release Date: 5/31/2024 |