|
Download Data (XLS File) |
|
||||||||
|
||||||||
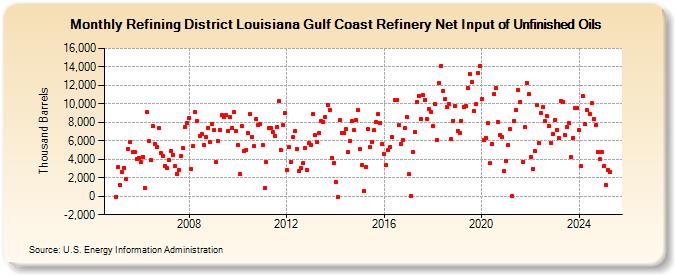
| Refining District Louisiana Gulf Coast Refinery Net Input of Unfinished Oils (Thousand Barrels) | ||||||||
| Year | Jan | Feb | Mar | Apr | May | Jun | Jul | Aug | Sep | Oct | Nov | Dec |
|---|---|---|---|---|---|---|---|---|---|---|---|---|
| 2005 | -45 | 3,117 | 1,195 | 2,592 | 3,100 | 1,855 | 5,132 | 5,876 | 4,795 | 4,749 | 4,075 | 4,174 |
| 2006 | 3,653 | 4,248 | 910 | 9,062 | 5,982 | 3,879 | 7,589 | 5,676 | 5,287 | 7,333 | 4,677 | 4,350 |
| 2007 | 3,309 | 3,029 | 3,911 | 4,906 | 4,503 | 3,251 | 2,441 | 2,845 | 4,308 | 5,211 | 7,519 | 7,931 |
| 2008 | 8,482 | 2,969 | 5,426 | 9,117 | 8,158 | 6,515 | 6,721 | 5,571 | 6,388 | 7,391 | 5,919 | 7,867 |
| 2009 | 7,122 | 3,655 | 6,000 | 7,154 | 8,818 | 8,548 | 8,767 | 7,037 | 8,538 | 7,417 | 9,100 | 7,006 |
| 2010 | 5,529 | 2,388 | 7,599 | 4,938 | 5,052 | 6,847 | 8,924 | 6,391 | 5,406 | 8,369 | 7,718 | 7,780 |
| 2011 | 5,570 | 877 | 3,674 | 7,333 | 7,352 | 6,950 | 6,510 | 7,502 | 10,268 | 5,040 | 7,666 | 9,006 |
| 2012 | 2,800 | 5,337 | 3,672 | 6,363 | 7,036 | 5,097 | 2,710 | 3,027 | 3,572 | 5,268 | 2,836 | 5,710 |
| 2013 | 5,547 | 8,869 | 6,618 | 5,875 | 6,860 | 8,159 | 8,081 | 8,567 | 9,923 | 9,354 | 4,153 | 3,605 |
| 2014 | 1,568 | -64 | 8,206 | 6,833 | 6,831 | 7,235 | 4,779 | 6,020 | 8,088 | 7,120 | 8,199 | 9,333 |
| 2015 | 5,137 | 3,369 | 541 | 3,127 | 7,228 | 5,321 | 5,871 | 7,124 | 8,046 | 8,871 | 7,959 | 5,633 |
| 2016 | 4,559 | 3,364 | 4,954 | 5,376 | 6,372 | 10,373 | 10,448 | 7,666 | 5,661 | 6,071 | 7,338 | 8,574 |
| 2017 | 2,387 | 37 | 4,818 | 6,905 | 10,242 | 10,875 | 8,411 | 10,956 | 10,377 | 8,380 | 9,445 | 9,153 |
| 2018 | 7,610 | 9,949 | 6,094 | 12,291 | 14,120 | 11,442 | 10,554 | 9,697 | 9,977 | 6,164 | 8,169 | 9,749 |
| 2019 | 7,035 | 6,896 | 8,149 | 9,711 | 9,757 | 11,712 | 13,244 | 12,390 | 9,253 | 9,950 | 13,313 | 14,099 |
| 2020 | 10,490 | 6,051 | 6,341 | 7,906 | 3,554 | 5,657 | 11,015 | 11,670 | 8,072 | 6,587 | 6,398 | 2,701 |
| 2021 | 3,827 | 5,568 | 7,273 | -28 | 8,189 | 9,349 | 11,489 | 10,248 | 3,753 | 7,471 | 12,287 | 11,022 |
| 2022 | 4,247 | 2,962 | 4,865 | 9,908 | 5,768 | 9,013 | 9,613 | 8,091 | 8,695 | 7,609 | 5,799 | 6,712 |
| 2023 | 8,239 | 7,185 | 6,289 | 10,358 | 10,249 | 6,585 | 7,451 | 7,900 | 4,229 | 6,332 | 9,543 | 9,558 |
| 2024 | 7,182 | 3,235 | 10,796 | 7,774 | 9,296 | 8,918 | ||||||
| - = No Data Reported; -- = Not Applicable; NA = Not Available; W = Withheld to avoid disclosure of individual company data. |
| Release Date: 8/30/2024 |
| Next Release Date: 9/30/2024 |