|
Download Data (XLS File) |
|
||||||||
|
||||||||
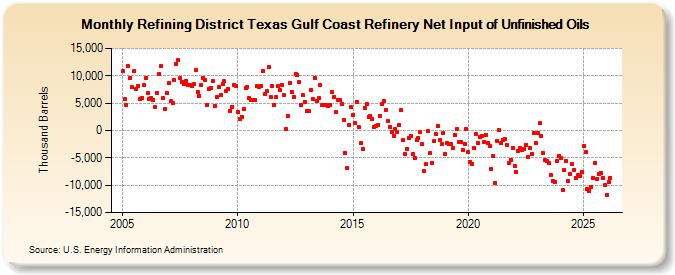
| Refining District Texas Gulf Coast Refinery Net Input of Unfinished Oils (Thousand Barrels) | ||||||||
| Year | Jan | Feb | Mar | Apr | May | Jun | Jul | Aug | Sep | Oct | Nov | Dec |
|---|---|---|---|---|---|---|---|---|---|---|---|---|
| 2005 | 10,865 | 5,702 | 4,584 | 11,736 | 9,612 | 7,957 | 10,894 | 7,621 | 8,146 | 5,699 | 5,982 | 8,384 |
| 2006 | 9,624 | 6,777 | 5,820 | 5,983 | 5,643 | 4,240 | 6,863 | 10,387 | 11,708 | 5,931 | 3,867 | 6,800 |
| 2007 | 8,601 | 5,323 | 5,081 | 9,270 | 12,178 | 12,814 | 9,536 | 8,894 | 8,448 | 8,970 | 8,389 | 8,282 |
| 2008 | 8,109 | 8,415 | 10,998 | 6,944 | 6,216 | 8,275 | 9,584 | 9,173 | 4,658 | 7,639 | 7,809 | 9,009 |
| 2009 | 4,488 | 6,085 | 7,908 | 6,504 | 8,435 | 8,994 | 7,255 | 7,619 | 3,563 | 4,362 | 8,347 | 8,150 |
| 2010 | 3,387 | 2,114 | 2,514 | 3,964 | 7,788 | 7,973 | 5,943 | 5,594 | 5,530 | 5,506 | 8,073 | 7,994 |
| 2011 | 8,038 | 10,813 | 6,580 | 7,205 | 11,550 | 6,060 | 8,044 | 4,655 | 6,028 | 8,105 | 7,372 | 8,348 |
| 2012 | 6,431 | 181 | 2,638 | 8,734 | 7,085 | 6,169 | 10,389 | 10,084 | 8,825 | 4,746 | 6,473 | 5,248 |
| 2013 | 3,648 | 3,613 | 7,438 | 5,819 | 9,597 | 5,384 | 5,932 | 8,279 | 4,648 | 4,577 | 4,584 | 4,433 |
| 2014 | 4,575 | 7,092 | 6,191 | 3,364 | 5,613 | 5,600 | 4,784 | 1,945 | -4,150 | -6,948 | 951 | 4,248 |
| 2015 | 2,853 | 1,277 | 5,160 | 559 | -2,366 | -3,368 | 4,116 | 4,802 | 2,483 | 2,659 | 2,126 | 689 |
| 2016 | 895 | 1,046 | 2,666 | 4,806 | 5,375 | 3,830 | 1,760 | 662 | -266 | -1,009 | 220 | -308 |
| 2017 | 1,091 | 3,692 | -1,735 | -4,208 | -3,298 | -1,317 | -947 | -4,296 | -5,021 | -1,830 | -1,417 | -325 |
| 2018 | -2,479 | -7,472 | -6,182 | -56 | -4,043 | -5,902 | -1,987 | -604 | 787 | -1,727 | -2,535 | -471 |
| 2019 | -4,256 | -2,329 | -2,496 | -2,404 | -3,218 | -895 | 265 | -2,094 | -2,098 | -3,611 | -2,400 | 222 |
| 2020 | -4,023 | -5,745 | -6,074 | -3,214 | -637 | -2,225 | -1,195 | -938 | -2,136 | -766 | -2,217 | -2,791 |
| 2021 | -7,082 | -4,632 | -9,526 | -1,938 | 65 | -2,336 | -1,682 | -1,593 | -2,646 | -5,920 | -5,351 | -3,155 |
| 2022 | -6,409 | -7,575 | -3,671 | -3,157 | -3,574 | -3,361 | -2,586 | -4,868 | -3,213 | -4,315 | -528 | -2,256 |
| 2023 | -462 | 1,323 | -711 | -3,860 | -5,007 | -5,237 | -5,586 | -7,734 | -8,826 | -9,092 | -5,231 | -4,579 |
| 2024 | -5,001 | |||||||||||
| - = No Data Reported; -- = Not Applicable; NA = Not Available; W = Withheld to avoid disclosure of individual company data. |
| Release Date: 3/29/2024 |
| Next Release Date: 4/30/2024 |