|
Download Data (XLS File) |
|
||||||||
|
||||||||
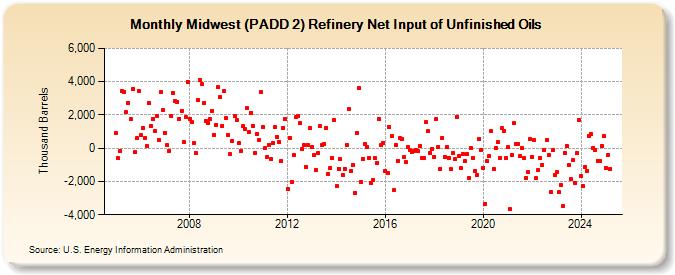
| Midwest (PADD 2) Refinery Net Input of Unfinished Oils (Thousand Barrels) | ||||||||
| Year | Jan | Feb | Mar | Apr | May | Jun | Jul | Aug | Sep | Oct | Nov | Dec |
|---|---|---|---|---|---|---|---|---|---|---|---|---|
| 2005 | 919 | -619 | -149 | 3,421 | 3,383 | 2,151 | 2,706 | 1,731 | 3,555 | -258 | 600 | 3,460 |
| 2006 | 770 | 1,193 | 627 | 104 | 2,732 | 1,358 | 1,781 | 1,049 | 1,937 | 481 | 3,348 | 2,278 |
| 2007 | 931 | 176 | -146 | 1,912 | 3,336 | 2,832 | 2,762 | 1,780 | 2,255 | 370 | 1,874 | 3,985 |
| 2008 | 1,771 | 1,569 | 298 | -270 | 2,882 | 4,090 | 3,853 | 2,721 | 1,663 | 1,488 | 1,728 | 2,264 |
| 2009 | 818 | 1,414 | 3,671 | 3,096 | 1,336 | 3,420 | 1,825 | 799 | -365 | 450 | 1,927 | 1,687 |
| 2010 | 287 | -179 | 1,307 | 1,172 | 2,392 | 960 | 2,143 | 1,347 | -282 | 880 | 474 | 3,353 |
| 2011 | 1,272 | 18 | -527 | 221 | -673 | 282 | 1,248 | 646 | 350 | -790 | 1,242 | 1,739 |
| 2012 | -2,424 | 633 | -2,009 | -422 | 1,857 | 1,919 | 1,511 | -59 | 206 | -1,116 | 187 | 1,201 |
| 2013 | 67 | -435 | -1,324 | -286 | 1,317 | 170 | 238 | 1,215 | -1,559 | -1,179 | -605 | 1,706 |
| 2014 | -2,273 | -1,230 | -646 | -1,592 | -1,244 | 184 | 2,344 | -1,370 | -1,021 | -2,669 | 942 | 3,591 |
| 2015 | -2,018 | -638 | 245 | 58 | -568 | -2,066 | -1,906 | -599 | -873 | 1,746 | 173 | 340 |
| 2016 | -1,360 | -1,471 | 1,272 | 733 | -2,538 | 199 | -753 | 604 | 525 | -546 | -859 | 80 |
| 2017 | -137 | -218 | -149 | -127 | -176 | 132 | -573 | -582 | 1,559 | 1,008 | -291 | -32 |
| 2018 | -511 | 1,760 | 75 | -1,227 | 633 | -522 | 60 | -565 | -1,279 | -277 | -632 | 1,901 |
| 2019 | -456 | -1,203 | -335 | -794 | -359 | -1,785 | -2 | -565 | -1,362 | -1,603 | 578 | -114 |
| 2020 | -1,173 | -3,327 | -780 | -477 | 1,016 | -1,252 | 38 | 367 | -582 | 1,184 | 1,045 | -616 |
| 2021 | 45 | -3,675 | -418 | 1,486 | 253 | 254 | -481 | 26 | -587 | -1,772 | -1,458 | 561 |
| 2022 | -510 | 494 | -1,814 | -1,338 | -562 | -1,022 | -120 | 500 | -416 | -2,651 | -138 | -1,625 |
| 2023 | -1,410 | -2,650 | -2,219 | -3,496 | -271 | 139 | -1,026 | -1,858 | -722 | -2,074 | -314 | 1,723 |
| 2024 | -1,664 | |||||||||||
| - = No Data Reported; -- = Not Applicable; NA = Not Available; W = Withheld to avoid disclosure of individual company data. |
| Release Date: 3/29/2024 |
| Next Release Date: 4/30/2024 |
Referring Pages: