|
Download Data (XLS File) |
|
||||||||
|
||||||||
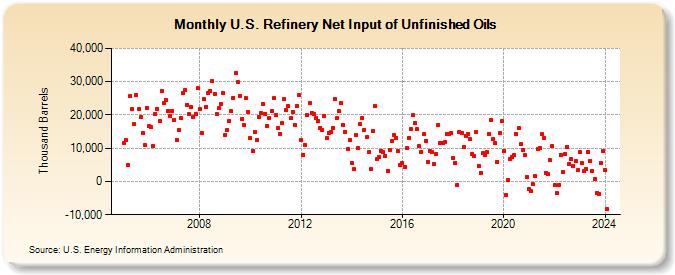
| U.S. Refinery Net Input of Unfinished Oils (Thousand Barrels) | ||||||||
| Year | Jan | Feb | Mar | Apr | May | Jun | Jul | Aug | Sep | Oct | Nov | Dec |
|---|---|---|---|---|---|---|---|---|---|---|---|---|
| 2005 | 11,422 | 12,374 | 5,040 | 25,553 | 21,708 | 17,139 | 26,027 | 21,727 | 19,241 | 14,423 | 10,922 | 22,155 |
| 2006 | 16,613 | 16,255 | 10,583 | 20,299 | 21,898 | 18,023 | 27,272 | 23,594 | 24,558 | 21,251 | 19,783 | 21,252 |
| 2007 | 18,596 | 12,535 | 15,336 | 19,208 | 26,453 | 27,570 | 23,066 | 20,266 | 22,331 | 19,355 | 20,412 | 27,987 |
| 2008 | 21,832 | 14,531 | 24,735 | 22,458 | 26,525 | 27,292 | 30,244 | 26,349 | 20,244 | 22,148 | 23,316 | 26,562 |
| 2009 | 14,061 | 15,427 | 18,136 | 21,035 | 25,174 | 32,479 | 29,785 | 25,797 | 18,857 | 16,981 | 24,938 | 20,966 |
| 2010 | 13,196 | 9,097 | 14,792 | 12,502 | 19,385 | 20,557 | 23,313 | 20,392 | 16,762 | 19,056 | 21,081 | 24,953 |
| 2011 | 20,013 | 16,111 | 14,366 | 17,552 | 24,666 | 21,363 | 22,539 | 18,930 | 21,012 | 16,900 | 22,768 | 25,898 |
| 2012 | 12,519 | 7,970 | 10,981 | 19,967 | 23,448 | 20,627 | 20,248 | 18,964 | 18,202 | 16,147 | 15,489 | 19,806 |
| 2013 | 12,926 | 14,687 | 14,798 | 15,984 | 24,712 | 18,939 | 21,154 | 23,663 | 16,938 | 14,911 | 9,606 | 12,446 |
| 2014 | 5,696 | 3,641 | 14,065 | 10,007 | 17,254 | 19,124 | 15,609 | 13,317 | 8,741 | 3,715 | 15,291 | 22,658 |
| 2015 | 6,645 | 7,417 | 9,254 | 8,807 | 7,737 | 3,176 | 9,474 | 12,035 | 13,883 | 13,080 | 9,168 | 4,798 |
| 2016 | 5,500 | 4,478 | 9,928 | 13,129 | 15,687 | 19,847 | 17,515 | 15,645 | 10,531 | 8,785 | 14,229 | 12,283 |
| 2017 | 5,984 | 9,247 | 8,985 | 5,331 | 8,115 | 16,925 | 11,414 | 11,671 | 11,736 | 14,281 | 14,211 | 14,438 |
| 2018 | 6,907 | 5,559 | -997 | 14,940 | 14,700 | 10,363 | 13,724 | 14,238 | 12,678 | 8,374 | 7,771 | 14,737 |
| 2019 | 4,655 | 2,622 | 8,464 | 7,860 | 8,746 | 14,410 | 18,544 | 12,786 | 11,468 | 5,949 | 14,506 | 18,178 |
| 2020 | 9,224 | -4,071 | 348 | 6,854 | 7,440 | 8,011 | 14,279 | 15,942 | 11,164 | 9,376 | 7,810 | 1,417 |
| 2021 | -2,191 | -2,965 | -893 | 1,495 | 9,812 | 10,179 | 14,122 | 13,144 | 2,552 | 2,128 | 6,357 | 10,767 |
| 2022 | -1,101 | -3,490 | -1,127 | 8,046 | 2,818 | 8,364 | 10,466 | 5,107 | 6,670 | 4,639 | 6,008 | 3,302 |
| 2023 | 8,748 | 5,516 | 3,279 | 3,802 | 8,860 | 6,168 | 3,093 | 748 | -3,594 | -3,691 | 5,584 | 9,279 |
| 2024 | 3,442 | |||||||||||
| - = No Data Reported; -- = Not Applicable; NA = Not Available; W = Withheld to avoid disclosure of individual company data. |
| Release Date: 3/29/2024 |
| Next Release Date: 4/30/2024 |
Referring Pages: