|
Download Data (XLS File) |
|
||||||||
|
||||||||
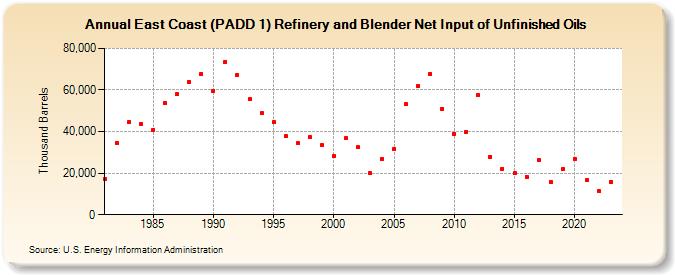
| East Coast (PADD 1) Refinery and Blender Net Input of Unfinished Oils (Thousand Barrels) | ||||||||
| Decade | Year-0 | Year-1 | Year-2 | Year-3 | Year-4 | Year-5 | Year-6 | Year-7 | Year-8 | Year-9 |
|---|---|---|---|---|---|---|---|---|---|---|
| 1980's | 17,033 | 34,555 | 44,474 | 43,840 | 40,884 | 53,809 | 57,972 | 63,914 | 67,648 | |
| 1990's | 59,669 | 73,611 | 67,342 | 55,615 | 48,741 | 44,530 | 37,679 | 34,346 | 37,419 | 33,379 |
| 2000's | 28,222 | 36,661 | 32,373 | 19,928 | 26,818 | 31,487 | 53,198 | 61,984 | 67,913 | 50,968 |
| 2010's | 39,022 | 39,998 | 57,636 | 27,911 | 22,168 | 19,869 | 18,190 | 26,106 | 15,841 | 21,845 |
| 2020's | 26,958 | 16,532 | 11,250 | 15,718 |
| - = No Data Reported; -- = Not Applicable; NA = Not Available; W = Withheld to avoid disclosure of individual company data. |
| Release Date: 3/29/2024 |
| Next Release Date: 8/30/2024 |