|
Download Data (XLS File) |
|
||||||||
|
||||||||
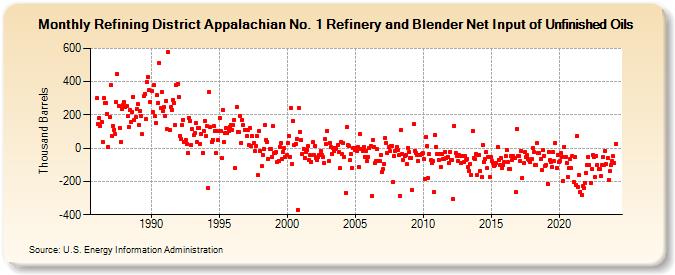
| Refining District Appalachian No. 1 Refinery and Blender Net Input of Unfinished Oils (Thousand Barrels) | ||||||||
| Year | Jan | Feb | Mar | Apr | May | Jun | Jul | Aug | Sep | Oct | Nov | Dec |
|---|---|---|---|---|---|---|---|---|---|---|---|---|
| 1986 | 299 | 145 | 180 | 133 | 158 | 40 | 300 | 273 | 273 | 206 | 6 | 186 |
| 1987 | 377 | 75 | 136 | 112 | 87 | 278 | 446 | 255 | 122 | 40 | 235 | 259 |
| 1988 | 275 | 245 | 252 | 192 | 127 | 228 | 157 | 219 | 310 | 169 | 185 | 238 |
| 1989 | 263 | 140 | 223 | 192 | 83 | 312 | 325 | 174 | 396 | 430 | 349 | 279 |
| 1990 | 346 | 216 | 379 | 191 | 154 | 318 | 274 | 514 | 240 | 338 | 225 | 245 |
| 1991 | 192 | 284 | 113 | 576 | 108 | 249 | 229 | 291 | 273 | 138 | 378 | 388 |
| 1992 | 307 | 76 | 56 | 141 | 171 | 39 | 50 | 28 | -27 | 184 | 164 | 18 |
| 1993 | 113 | 77 | 90 | 154 | 37 | 121 | 122 | 28 | 83 | -26 | 106 | 165 |
| 1994 | 76 | 132 | -240 | 335 | 125 | 40 | 52 | 133 | 106 | -31 | 102 | 49 |
| 1995 | 182 | 106 | -61 | 230 | 37 | 94 | 122 | 92 | 101 | 129 | 140 | 111 |
| 1996 | 137 | 171 | -120 | 250 | 100 | 96 | 196 | 34 | 169 | 139 | 112 | 108 |
| 1997 | 73 | 112 | 17 | 122 | 15 | 73 | 31 | -19 | 14 | 76 | -163 | 105 |
| 1998 | -16 | -110 | -38 | -4 | 138 | 52 | 40 | -63 | -6 | -7 | -53 | 133 |
| 1999 | -28 | -30 | -23 | -86 | -76 | 10 | 30 | -66 | -20 | 0 | -51 | -42 |
| 2000 | 31 | 74 | -50 | 244 | -98 | 162 | 20 | 27 | 54 | -369 | 240 | 99 |
| 2001 | 47 | -33 | -3 | -59 | -23 | -8 | 11 | -70 | -42 | -81 | 35 | -38 |
| 2002 | 15 | -59 | -69 | -54 | -39 | -16 | -42 | -50 | -88 | 53 | 28 | 104 |
| 2003 | -78 | 33 | 8 | -34 | 1 | -17 | -3 | 0 | 19 | -25 | -121 | 38 |
| 2004 | -36 | 32 | -56 | -267 | 125 | 17 | 16 | -74 | -35 | -117 | 3 | -11 |
| 2005 | 2 | -16 | 5 | -116 | 83 | -5 | -18 | 8 | -50 | -19 | -80 | -52 |
| 2006 | -1 | 14 | -285 | 50 | 9 | -91 | -76 | -7 | -75 | -79 | -39 | -143 |
| 2007 | -128 | -95 | 62 | 31 | -31 | 10 | -17 | 15 | 13 | -204 | -45 | -16 |
| 2008 | 10 | -10 | -43 | -287 | 108 | -35 | -70 | -45 | -42 | -98 | 2 | -23 |
| 2009 | -57 | -57 | -250 | 144 | -14 | -26 | -40 | -76 | -39 | -41 | -33 | -31 |
| 2010 | -66 | -185 | 68 | 12 | -178 | -35 | -73 | -91 | -79 | -261 | 80 | 10 |
| 2011 | -32 | -71 | -34 | -113 | -34 | -66 | -64 | -23 | -61 | -53 | -88 | -20 |
| 2012 | -72 | -69 | -306 | 135 | -27 | -44 | -77 | -43 | -48 | -92 | -48 | -86 |
| 2013 | -47 | -73 | -67 | -112 | -136 | -96 | -160 | 104 | -60 | -68 | -36 | -161 |
| 2014 | -40 | -42 | -138 | -172 | 19 | -82 | -66 | -20 | -121 | -55 | -173 | -52 |
| 2015 | -76 | -87 | -108 | -100 | -89 | 7 | -70 | -104 | -61 | -122 | -101 | -83 |
| 2016 | -48 | -9 | -84 | -128 | -125 | -49 | -73 | -46 | -61 | -264 | 118 | -49 |
| 2017 | -48 | -77 | -17 | -177 | -91 | -25 | -52 | -43 | -68 | -71 | -86 | -68 |
| 2018 | 1 | -22 | -102 | -101 | 32 | -28 | -31 | -66 | -130 | -13 | -44 | -106 |
| 2019 | -104 | -214 | -20 | -73 | -85 | -114 | -23 | -78 | 31 | -119 | -38 | -81 |
| 2020 | -75 | -28 | -50 | -195 | 9 | -53 | -87 | -174 | -120 | -68 | -119 | -49 |
| 2021 | -206 | -50 | -221 | 73 | -232 | -164 | -261 | -283 | -229 | -237 | -207 | -148 |
| 2022 | -102 | -54 | -102 | -209 | -126 | -42 | -54 | -176 | -46 | -100 | -125 | -126 |
| 2023 | -169 | -101 | -55 | -103 | -16 | -95 | -60 | -189 | -140 | -104 | -78 | -49 |
| 2024 | -87 | |||||||||||
| - = No Data Reported; -- = Not Applicable; NA = Not Available; W = Withheld to avoid disclosure of individual company data. |
| Release Date: 3/29/2024 |
| Next Release Date: 4/30/2024 |