|
Download Data (XLS File) |
|
||||||||
|
||||||||
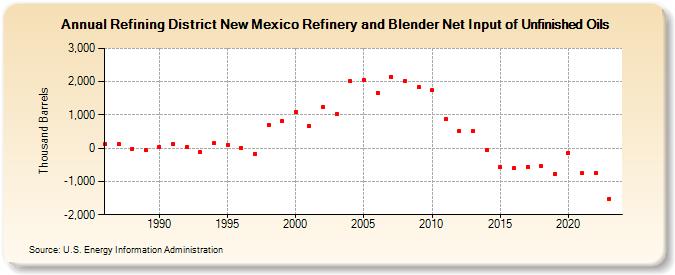
| Refining District New Mexico Refinery and Blender Net Input of Unfinished Oils (Thousand Barrels) | ||||||||
| Decade | Year-0 | Year-1 | Year-2 | Year-3 | Year-4 | Year-5 | Year-6 | Year-7 | Year-8 | Year-9 |
|---|---|---|---|---|---|---|---|---|---|---|
| 1980's | 115 | 113 | -13 | -55 | ||||||
| 1990's | 39 | 137 | 36 | -127 | 142 | 101 | 14 | -166 | 701 | 808 |
| 2000's | 1,089 | 675 | 1,253 | 1,030 | 2,006 | 2,049 | 1,665 | 2,153 | 2,009 | 1,835 |
| 2010's | 1,735 | 875 | 521 | 529 | -68 | -563 | -606 | -552 | -544 | -772 |
| 2020's | -137 | -755 | -750 | -1,520 |
| - = No Data Reported; -- = Not Applicable; NA = Not Available; W = Withheld to avoid disclosure of individual company data. |
| Release Date: 3/29/2024 |
| Next Release Date: 8/30/2024 |