|
Download Data (XLS File) |
|
||||||||
|
||||||||
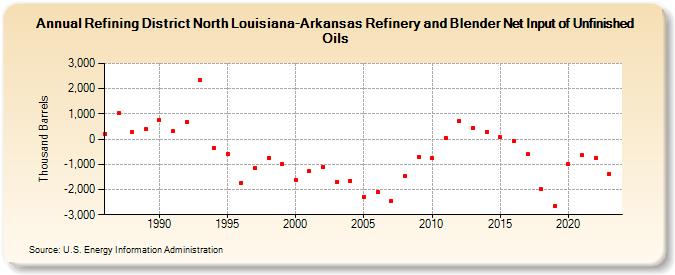
| Refining District North Louisiana-Arkansas Refinery and Blender Net Input of Unfinished Oils (Thousand Barrels) | ||||||||
| Decade | Year-0 | Year-1 | Year-2 | Year-3 | Year-4 | Year-5 | Year-6 | Year-7 | Year-8 | Year-9 |
|---|---|---|---|---|---|---|---|---|---|---|
| 1980's | 220 | 1,016 | 271 | 389 | ||||||
| 1990's | 763 | 308 | 691 | 2,334 | -339 | -580 | -1,722 | -1,152 | -742 | -972 |
| 2000's | -1,640 | -1,275 | -1,088 | -1,699 | -1,654 | -2,279 | -2,087 | -2,445 | -1,475 | -691 |
| 2010's | -761 | 62 | 711 | 458 | 293 | 78 | -85 | -594 | -1,996 | -2,665 |
| 2020's | -989 | -631 | -755 | -1,367 |
| - = No Data Reported; -- = Not Applicable; NA = Not Available; W = Withheld to avoid disclosure of individual company data. |
| Release Date: 3/29/2024 |
| Next Release Date: 8/30/2024 |