|
Download Data (XLS File) |
|
||||||||
|
||||||||
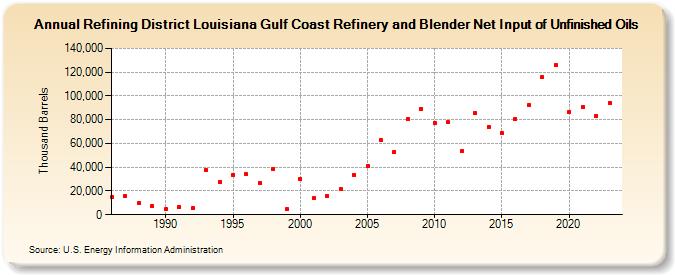
| Refining District Louisiana Gulf Coast Refinery and Blender Net Input of Unfinished Oils (Thousand Barrels) | ||||||||
| Decade | Year-0 | Year-1 | Year-2 | Year-3 | Year-4 | Year-5 | Year-6 | Year-7 | Year-8 | Year-9 |
|---|---|---|---|---|---|---|---|---|---|---|
| 1980's | 14,696 | 15,910 | 10,177 | 7,082 | ||||||
| 1990's | 4,469 | 6,424 | 5,426 | 37,547 | 27,596 | 33,771 | 34,057 | 26,870 | 38,354 | 4,438 |
| 2000's | 30,038 | 13,696 | 15,580 | 21,326 | 33,783 | 40,615 | 62,646 | 53,164 | 80,524 | 89,359 |
| 2010's | 77,195 | 77,682 | 53,446 | 85,762 | 73,968 | 68,729 | 80,536 | 92,142 | 115,595 | 126,011 |
| 2020's | 86,558 | 90,532 | 83,241 | 93,904 |
| - = No Data Reported; -- = Not Applicable; NA = Not Available; W = Withheld to avoid disclosure of individual company data. |
| Release Date: 3/29/2024 |
| Next Release Date: 8/30/2024 |