|
Download Data (XLS File) |
|
||||||||
|
||||||||
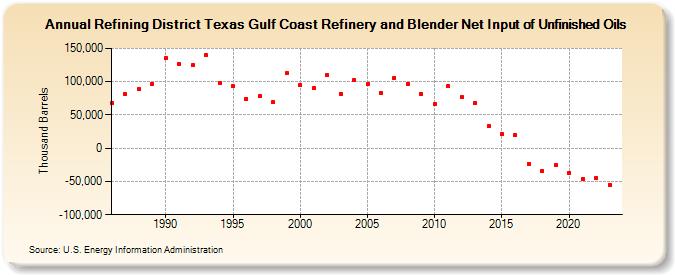
| Refining District Texas Gulf Coast Refinery and Blender Net Input of Unfinished Oils (Thousand Barrels) | ||||||||
| Decade | Year-0 | Year-1 | Year-2 | Year-3 | Year-4 | Year-5 | Year-6 | Year-7 | Year-8 | Year-9 |
|---|---|---|---|---|---|---|---|---|---|---|
| 1980's | 67,726 | 80,695 | 88,939 | 96,450 | ||||||
| 1990's | 135,198 | 126,460 | 124,886 | 139,499 | 98,261 | 93,276 | 74,312 | 77,991 | 68,975 | 112,378 |
| 2000's | 94,907 | 89,884 | 109,553 | 82,067 | 102,281 | 97,182 | 83,643 | 105,786 | 96,829 | 81,710 |
| 2010's | 66,380 | 92,798 | 77,003 | 68,152 | 33,317 | 20,990 | 19,677 | -23,180 | -34,292 | -25,887 |
| 2020's | -36,570 | -45,796 | -45,513 | -54,905 |
| - = No Data Reported; -- = Not Applicable; NA = Not Available; W = Withheld to avoid disclosure of individual company data. |
| Release Date: 3/29/2024 |
| Next Release Date: 8/30/2024 |