|
Download Data (XLS File) |
|
||||||||
|
||||||||
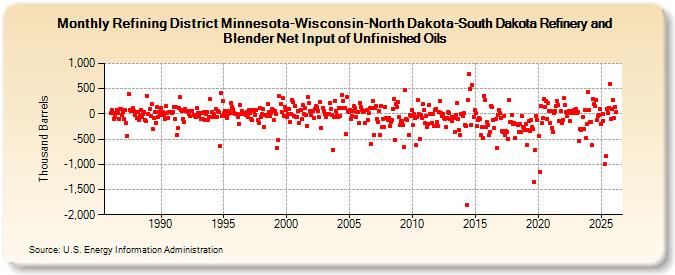
| Refining District Minnesota-Wisconsin-North Dakota-South Dakota Refinery and Blender Net Input of Unfinished Oils (Thousand Barrels) | ||||||||
| Year | Jan | Feb | Mar | Apr | May | Jun | Jul | Aug | Sep | Oct | Nov | Dec |
|---|---|---|---|---|---|---|---|---|---|---|---|---|
| 1986 | 14 | 71 | 11 | -103 | -53 | 21 | 73 | 20 | -95 | 104 | 103 | -16 |
| 1987 | 34 | -102 | 72 | -190 | -433 | 400 | 87 | 49 | 58 | 109 | 60 | -13 |
| 1988 | 38 | -87 | 40 | -121 | -48 | 79 | -64 | 3 | 38 | -131 | -149 | 352 |
| 1989 | 5 | 94 | -32 | 204 | -297 | -85 | 32 | -177 | 132 | -61 | 33 | -19 |
| 1990 | 119 | -28 | 30 | -19 | -104 | 154 | 18 | -81 | 33 | 31 | 13 | 28 |
| 1991 | 145 | -105 | 133 | -412 | -289 | 107 | 333 | 81 | 62 | -94 | -151 | 97 |
| 1992 | 52 | 59 | 29 | -1 | -49 | 64 | 59 | -29 | -33 | -68 | 112 | 17 |
| 1993 | -45 | 23 | -100 | 25 | -94 | 31 | -120 | 0 | 28 | -113 | -53 | 302 |
| 1994 | -60 | 32 | -59 | -9 | 105 | -67 | 51 | 35 | -645 | 410 | -34 | 254 |
| 1995 | 19 | 59 | -48 | -83 | 5 | 48 | 9 | 216 | 128 | 92 | 21 | -11 |
| 1996 | -7 | -56 | -191 | 182 | 7 | 67 | 17 | 26 | -3 | -21 | 40 | -64 |
| 1997 | 87 | 21 | -99 | -121 | 79 | 57 | -19 | 70 | -116 | -181 | 109 | -54 |
| 1998 | -11 | 89 | -258 | -13 | -16 | -45 | 189 | 30 | -50 | 24 | 98 | 86 |
| 1999 | -117 | 60 | -5 | -678 | -523 | 357 | 206 | 47 | 308 | -37 | 135 | 83 |
| 2000 | -55 | -9 | 105 | -157 | 7 | 284 | 235 | -46 | 156 | -61 | -63 | 66 |
| 2001 | -174 | 78 | -109 | 185 | -10 | 109 | -29 | -241 | 337 | 211 | 58 | -31 |
| 2002 | 54 | 59 | -75 | 92 | 148 | 127 | 57 | -71 | 227 | -279 | 118 | 62 |
| 2003 | -7 | -62 | 3 | 4 | 0 | 208 | 98 | -24 | -713 | -70 | 252 | 59 |
| 2004 | -23 | -68 | 125 | -50 | 108 | 377 | 259 | 115 | -396 | 344 | 49 | 39 |
| 2005 | 69 | -102 | -41 | 66 | 159 | 113 | -64 | 32 | 45 | -181 | 207 | 133 |
| 2006 | 75 | 31 | 50 | -184 | 70 | -127 | 11 | 115 | -598 | 122 | 249 | -414 |
| 2007 | 120 | 153 | -98 | -157 | 65 | -423 | 165 | -257 | -97 | -252 | 144 | -82 |
| 2008 | -130 | -82 | -247 | -167 | -123 | 101 | 305 | -522 | 203 | 136 | 226 | -54 |
| 2009 | -214 | -144 | -140 | -229 | -661 | 468 | -100 | -126 | -410 | -26 | -33 | 73 |
| 2010 | -216 | 7 | -86 | -620 | -70 | 278 | 0 | -490 | -18 | -78 | 189 | 82 |
| 2011 | -185 | -32 | -258 | -192 | 179 | -9 | -175 | 0 | -237 | 80 | 98 | -153 |
| 2012 | -238 | 37 | 247 | 9 | -35 | 7 | -79 | -100 | -261 | -80 | 47 | 9 |
| 2013 | -96 | -134 | -58 | -75 | -366 | -27 | 211 | -97 | -329 | -423 | -3 | -3 |
| 2014 | -41 | 13 | -217 | -243 | -1,813 | 276 | 801 | 484 | -213 | 573 | -65 | 78 |
| 2015 | 9 | -248 | -119 | -90 | -106 | -426 | -262 | -485 | 360 | 267 | -253 | -162 |
| 2016 | -225 | -427 | -353 | 164 | 128 | -121 | -289 | -111 | -678 | -13 | 80 | 9 |
| 2017 | -86 | -343 | -367 | -35 | -409 | -348 | -359 | -489 | 272 | -154 | -161 | -29 |
| 2018 | -210 | -173 | -475 | -193 | -211 | -351 | -192 | -368 | -44 | -257 | -278 | -329 |
| 2019 | -192 | -609 | -317 | -141 | -338 | -127 | -255 | -309 | -1,349 | -718 | -44 | -131 |
| 2020 | -438 | -1,146 | 156 | -186 | -77 | 295 | 127 | 264 | -102 | 221 | 58 | -189 |
| 2021 | 49 | -276 | -359 | 9 | 57 | 161 | 252 | 170 | -138 | 51 | -188 | -120 |
| 2022 | 306 | 173 | 41 | -43 | 31 | 65 | -141 | 20 | 66 | 20 | 83 | 82 |
| 2023 | 89 | 8 | 29 | -542 | -290 | -317 | -63 | -302 | 74 | -485 | -207 | 434 |
| 2024 | 69 | |||||||||||
| - = No Data Reported; -- = Not Applicable; NA = Not Available; W = Withheld to avoid disclosure of individual company data. |
| Release Date: 3/29/2024 |
| Next Release Date: 4/30/2024 |