|
Download Data (XLS File) |
|
||||||||
|
||||||||
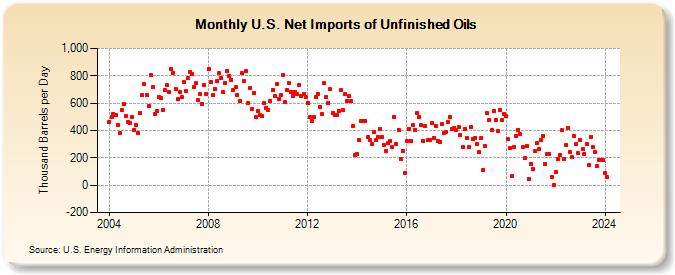
| U.S. Net Imports of Unfinished Oils (Thousand Barrels per Day) | ||||||||
| Year | Jan | Feb | Mar | Apr | May | Jun | Jul | Aug | Sep | Oct | Nov | Dec |
|---|---|---|---|---|---|---|---|---|---|---|---|---|
| 2004 | 465 | 499 | 521 | 512 | 440 | 379 | 551 | 596 | 504 | 465 | 451 | 496 |
| 2005 | 405 | 443 | 380 | 531 | 660 | 737 | 662 | 581 | 802 | 715 | 524 | 543 |
| 2006 | 645 | 639 | 549 | 693 | 730 | 678 | 851 | 823 | 702 | 629 | 680 | 646 |
| 2007 | 753 | 688 | 783 | 830 | 811 | 718 | 745 | 621 | 663 | 595 | 729 | 668 |
| 2008 | 851 | 753 | 660 | 701 | 758 | 817 | 780 | 681 | 748 | 838 | 798 | 772 |
| 2009 | 697 | 715 | 658 | 612 | 818 | 760 | 832 | 599 | 714 | 556 | 675 | 495 |
| 2010 | 545 | 510 | 503 | 600 | 567 | 547 | 617 | 695 | 653 | 738 | 631 | 660 |
| 2011 | 805 | 606 | 697 | 746 | 683 | 655 | 680 | 668 | 734 | 652 | 669 | 644 |
| 2012 | 604 | 498 | 468 | 500 | 642 | 670 | 575 | 523 | 745 | 643 | 602 | 701 |
| 2013 | 527 | 515 | 512 | 546 | 693 | 550 | 664 | 612 | 653 | 612 | 435 | 219 |
| 2014 | 225 | 330 | 469 | 471 | 469 | 350 | 330 | 302 | 389 | 328 | 355 | 414 |
| 2015 | 354 | 291 | 248 | 306 | 326 | 276 | 497 | 302 | 405 | 193 | 253 | 87 |
| 2016 | 322 | 412 | 326 | 437 | 406 | 526 | 502 | 440 | 326 | 436 | 333 | 333 |
| 2017 | 455 | 344 | 434 | 321 | 315 | 445 | 381 | 386 | 464 | 500 | 414 | 420 |
| 2018 | 406 | 424 | 369 | 282 | 410 | 342 | 277 | 428 | 341 | 347 | 304 | 244 |
| 2019 | 345 | 109 | 285 | 531 | 478 | 405 | 541 | 474 | 395 | 551 | 480 | 518 |
| 2020 | 509 | 339 | 274 | 65 | 280 | 357 | 407 | 373 | 281 | 196 | 290 | 48 |
| 2021 | 158 | 117 | 250 | 307 | 264 | 332 | 360 | 154 | 229 | 231 | 61 | -1 |
| 2022 | 95 | 192 | 220 | 400 | 190 | 292 | 417 | 245 | 203 | 358 | 301 | 235 |
| 2023 | 329 | 268 | 230 | 303 | 146 | 352 | 278 | 240 | 139 | 182 | 187 | 182 |
| 2024 | 92 | |||||||||||
| - = No Data Reported; -- = Not Applicable; NA = Not Available; W = Withheld to avoid disclosure of individual company data. |
| Release Date: 3/29/2024 |
| Next Release Date: 4/30/2024 |