|
Download Data (XLS File) |
|
||||||||
|
||||||||
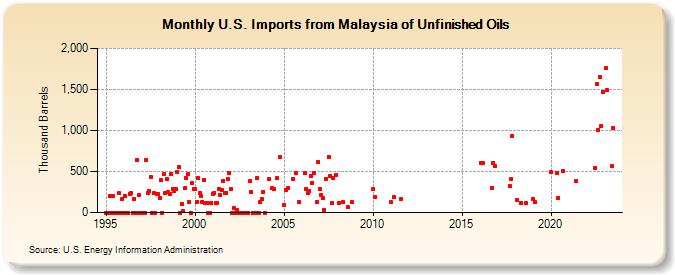
| U.S. Imports from Malaysia of Unfinished Oils (Thousand Barrels) | ||||||||
| Year | Jan | Feb | Mar | Apr | May | Jun | Jul | Aug | Sep | Oct | Nov | Dec |
|---|---|---|---|---|---|---|---|---|---|---|---|---|
| 1995 | 0 | 0 | 0 | 201 | 0 | 199 | 0 | 0 | 0 | 235 | 0 | 164 |
| 1996 | 0 | 203 | 0 | 0 | 230 | 241 | 0 | 170 | 0 | 645 | 213 | 0 |
| 1997 | 0 | 0 | 0 | 646 | 241 | 266 | 431 | 0 | 233 | 0 | 230 | 229 |
| 1998 | 173 | 396 | 0 | 470 | 240 | 414 | 249 | 230 | 474 | 290 | 263 | 282 |
| 1999 | 489 | 557 | 0 | 105 | 19 | 296 | 425 | 466 | 123 | 0 | 357 | 284 |
| 2000 | 286 | 125 | 418 | 238 | 201 | 130 | 400 | 113 | 120 | 0 | 0 | 122 |
| 2001 | 232 | 242 | 114 | 120 | 291 | 220 | 276 | 389 | 242 | 242 | 407 | 482 |
| 2002 | 285 | 0 | 54 | 0 | 36 | 0 | 0 | 0 | 0 | 0 | 0 | 0 |
| 2003 | 0 | 381 | 249 | 0 | 0 | 0 | 427 | 0 | 125 | 167 | 256 | 0 |
| 2004 | 409 | 295 | 292 | 416 | 681 | |||||||
| 2005 | 96 | 275 | 296 | 413 | 480 | 124 | ||||||
| 2006 | 481 | 290 | 238 | 266 | 441 | 365 | 480 | 126 | 616 | |||
| 2007 | 289 | 219 | 179 | 36 | 414 | 676 | 443 | 115 | 417 | 455 | ||
| 2008 | 122 | 124 | 67 | 124 | ||||||||
| 2010 | 287 | 187 | ||||||||||
| 2011 | 125 | 187 | 169 | |||||||||
| 2016 | 601 | 601 | 304 | 608 | 562 | |||||||
| 2017 | 326 | 410 | 930 | |||||||||
| 2018 | 150 | 120 | 112 | |||||||||
| 2019 | 163 | 126 | ||||||||||
| 2020 | 490 | 486 | 183 | 506 | ||||||||
| 2021 | 379 | |||||||||||
| 2022 | 548 | 1,570 | 1,006 | 1,654 | 1,054 | 1,468 | ||||||
| 2023 | 1,760 | 1,488 | 564 | 1,034 | ||||||||
| - = No Data Reported; -- = Not Applicable; NA = Not Available; W = Withheld to avoid disclosure of individual company data. |
| Release Date: 3/29/2024 |
| Next Release Date: 4/30/2024 |