|
Download Data (XLS File) |
|
||||||||
|
||||||||
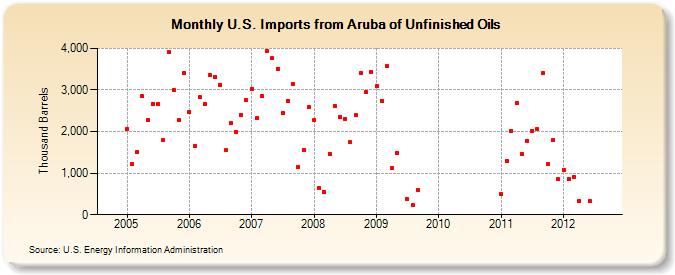
| U.S. Imports from Aruba of Unfinished Oils (Thousand Barrels) | ||||||||
| Year | Jan | Feb | Mar | Apr | May | Jun | Jul | Aug | Sep | Oct | Nov | Dec |
|---|---|---|---|---|---|---|---|---|---|---|---|---|
| 2005 | 2,068 | 1,216 | 1,508 | 2,843 | 2,282 | 2,671 | 2,662 | 1,790 | 3,914 | 3,002 | 2,267 | 3,407 |
| 2006 | 2,470 | 1,654 | 2,821 | 2,659 | 3,350 | 3,318 | 3,130 | 1,548 | 2,194 | 1,998 | 2,404 | 2,747 |
| 2007 | 3,033 | 2,322 | 2,844 | 3,945 | 3,767 | 3,512 | 2,438 | 2,725 | 3,145 | 1,152 | 1,545 | 2,588 |
| 2008 | 2,269 | 650 | 547 | 1,467 | 2,612 | 2,362 | 2,309 | 1,738 | 2,392 | 3,414 | 2,950 | 3,427 |
| 2009 | 3,088 | 2,743 | 3,567 | 1,115 | 1,485 | 375 | 222 | 596 | ||||
| 2011 | 490 | 1,295 | 2,022 | 2,680 | 1,472 | 1,774 | 2,019 | 2,071 | 3,398 | 1,211 | 1,789 | 852 |
| 2012 | 1,087 | 851 | 908 | 330 | 318 | |||||||
| - = No Data Reported; -- = Not Applicable; NA = Not Available; W = Withheld to avoid disclosure of individual company data. |
| Release Date: 4/30/2024 |
| Next Release Date: 5/31/2024 |