|
Download Data (XLS File) |
|
||||||||
|
||||||||
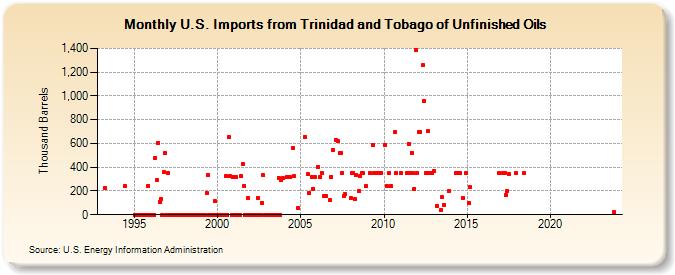
| U.S. Imports from Trinidad and Tobago of Unfinished Oils (Thousand Barrels) | ||||||||
| Year | Jan | Feb | Mar | Apr | May | Jun | Jul | Aug | Sep | Oct | Nov | Dec |
|---|---|---|---|---|---|---|---|---|---|---|---|---|
| 1993 | 221 | |||||||||||
| 1994 | 241 | |||||||||||
| 1995 | 0 | 0 | 0 | 0 | 0 | 0 | 0 | 0 | 0 | 0 | 240 | 0 |
| 1996 | 0 | 0 | 0 | 480 | 289 | 607 | 111 | 136 | 0 | 356 | 516 | 0 |
| 1997 | 349 | 0 | 0 | 0 | 0 | 0 | 0 | 0 | 0 | 0 | 0 | 0 |
| 1998 | 0 | 0 | 0 | 0 | 0 | 0 | 0 | 0 | 0 | 0 | 0 | 0 |
| 1999 | 0 | 0 | 0 | 0 | 183 | 331 | 0 | 0 | 0 | 0 | 112 | 0 |
| 2000 | 0 | 0 | 0 | 0 | 0 | 0 | 322 | 0 | 651 | 322 | 0 | 320 |
| 2001 | 0 | 320 | 0 | 0 | 0 | 323 | 431 | 240 | 0 | 0 | 138 | 0 |
| 2002 | 0 | 0 | 0 | 0 | 0 | 143 | 0 | 0 | 102 | 332 | 0 | 0 |
| 2003 | 0 | 0 | 0 | 0 | 0 | 0 | 0 | 0 | 310 | 0 | 290 | 306 |
| 2004 | 319 | 319 | 562 | 323 | 55 | |||||||
| 2005 | 655 | 339 | 185 | 320 | 220 | 320 | ||||||
| 2006 | 405 | 321 | 353 | 160 | 160 | 120 | 320 | 543 | ||||
| 2007 | 633 | 620 | 519 | 519 | 350 | 155 | 175 | |||||
| 2008 | 140 | 350 | 350 | 130 | 335 | 197 | 330 | 350 | 350 | 240 | ||
| 2009 | 347 | 591 | 349 | 351 | 350 | 351 | ||||||
| 2010 | 589 | 240 | 350 | 240 | 699 | 350 | ||||||
| 2011 | 350 | 347 | 597 | 349 | 523 | 350 | 220 | 1,390 | ||||
| 2012 | 351 | 700 | 700 | 1,256 | 958 | 349 | 350 | 701 | 351 | 349 | ||
| 2013 | 369 | 73 | 39 | 145 | 85 | 197 | ||||||
| 2014 | 350 | 352 | 350 | 144 | 350 | |||||||
| 2015 | 95 | 232 | ||||||||||
| 2016 | 348 | |||||||||||
| 2017 | 350 | 349 | 165 | 201 | 345 | 350 | ||||||
| 2018 | 348 | |||||||||||
| 2023 | 21 | |||||||||||
| - = No Data Reported; -- = Not Applicable; NA = Not Available; W = Withheld to avoid disclosure of individual company data. |
| Release Date: 3/29/2024 |
| Next Release Date: 4/30/2024 |