|
Download Data (XLS File) |
|
||||||||
|
||||||||
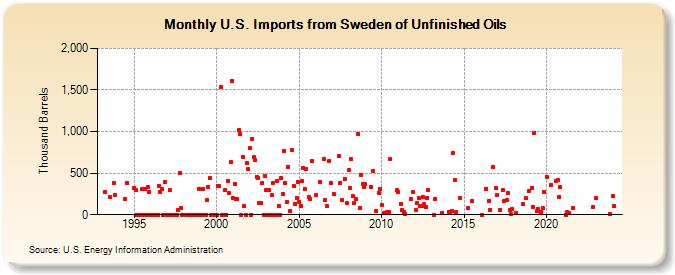
| U.S. Imports from Sweden of Unfinished Oils (Thousand Barrels) | ||||||||
| Year | Jan | Feb | Mar | Apr | May | Jun | Jul | Aug | Sep | Oct | Nov | Dec |
|---|---|---|---|---|---|---|---|---|---|---|---|---|
| 1993 | 274 | 207 | 381 | 241 | ||||||||
| 1994 | 185 | 381 | ||||||||||
| 1995 | 325 | 302 | 0 | 0 | 0 | 0 | 311 | 0 | 314 | 0 | 328 | 279 |
| 1996 | 0 | 0 | 0 | 0 | 0 | 0 | 349 | 275 | 310 | 0 | 390 | 0 |
| 1997 | 0 | 0 | 296 | 0 | 0 | 0 | 0 | 0 | 62 | 500 | 80 | 0 |
| 1998 | 0 | 0 | 0 | 0 | 0 | 0 | 0 | 0 | 0 | 0 | 0 | 311 |
| 1999 | 0 | 0 | 311 | 0 | 0 | 172 | 329 | 446 | 0 | 0 | 0 | 0 |
| 2000 | 0 | 344 | 344 | 1,541 | 0 | 0 | 296 | 0 | 411 | 258 | 628 | 1,603 |
| 2001 | 198 | 372 | 188 | 183 | 1,016 | 973 | 0 | 695 | 101 | 0 | 621 | 544 |
| 2002 | 798 | 0 | 914 | 689 | 654 | 451 | 443 | 137 | 140 | 382 | 0 | 467 |
| 2003 | 292 | 0 | 297 | 0 | 233 | 378 | 0 | 0 | 406 | 105 | 0 | 444 |
| 2004 | 254 | 762 | 379 | 147 | 577 | 41 | 780 | 340 | 129 | 204 | 398 | |
| 2005 | 158 | 103 | 401 | 564 | 311 | 548 | 215 | 192 | 641 | |||
| 2006 | 232 | 389 | 665 | 182 | 108 | 641 | 384 | |||||
| 2007 | 249 | 703 | 385 | 172 | 431 | 135 | ||||||
| 2008 | 533 | 324 | 666 | 221 | 139 | 192 | 967 | 84 | 473 | 371 | 336 | |
| 2009 | 367 | 337 | 529 | 45 | 267 | 313 | ||||||
| 2010 | 116 | 19 | 32 | 32 | 669 | 296 | ||||||
| 2011 | 278 | 130 | 56 | 27 | 3 | 184 | 272 | |||||
| 2012 | 55 | 143 | 205 | 109 | 108 | 209 | 132 | 87 | 199 | 303 | ||
| 2013 | 1 | 190 | 23 | |||||||||
| 2014 | 35 | 20 | 50 | 743 | 419 | 31 | 202 | |||||
| 2015 | 78 | 160 | ||||||||||
| 2016 | 1 | 313 | 166 | 62 | 579 | 325 | ||||||
| 2017 | 241 | 56 | 300 | 162 | 178 | 257 | 53 | 10 | 70 | |||
| 2018 | 16 | 124 | 195 | 284 | ||||||||
| 2019 | 320 | 94 | 986 | 39 | 66 | 37 | 83 | 279 | ||||
| 2020 | 455 | 356 | 410 | 417 | 210 | 332 | ||||||
| 2021 | 1 | 27 | 20 | 77 | ||||||||
| 2022 | 88 | |||||||||||
| 2023 | 199 | 3 | ||||||||||
| 2024 | 230 | |||||||||||
| - = No Data Reported; -- = Not Applicable; NA = Not Available; W = Withheld to avoid disclosure of individual company data. |
| Release Date: 3/29/2024 |
| Next Release Date: 4/30/2024 |