|
Download Data (XLS File) |
|
||||||||
|
||||||||
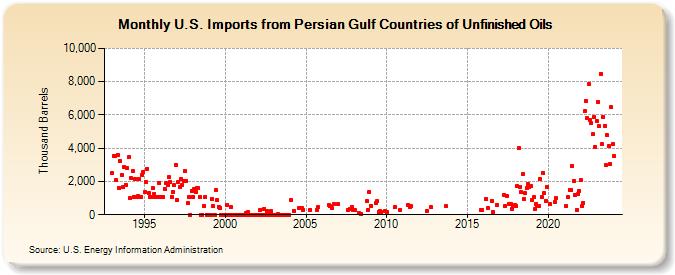
| U.S. Imports from Persian Gulf Countries of Unfinished Oils (Thousand Barrels) | ||||||||
| Year | Jan | Feb | Mar | Apr | May | Jun | Jul | Aug | Sep | Oct | Nov | Dec |
|---|---|---|---|---|---|---|---|---|---|---|---|---|
| 1993 | 2,493 | 3,557 | 3,557 | 2,082 | 3,588 | 1,595 | 3,242 | 2,388 | 1,662 | 2,865 | 1,803 | 2,820 |
| 1994 | 3,451 | 982 | 2,193 | 2,658 | 1,084 | 2,166 | 1,080 | 1,096 | 2,158 | 1,078 | 2,412 | 2,544 |
| 1995 | 1,376 | 1,994 | 2,773 | 1,299 | 1,078 | 1,089 | 1,617 | 1,256 | 1,083 | 1,083 | 1,087 | 1,893 |
| 1996 | 1,083 | 1,083 | 1,069 | 1,567 | 1,897 | 1,800 | 2,250 | 1,977 | 1,081 | 1,390 | 1,767 | 3,010 |
| 1997 | 895 | 1,968 | 1,673 | 2,155 | 1,801 | 2,024 | 2,616 | 2,053 | 698 | 1,077 | 0 | 1,454 |
| 1998 | 1,084 | 1,560 | 1,361 | 1,592 | 1,604 | 1,078 | 0 | 0 | 542 | 1,080 | 0 | 0 |
| 1999 | 0 | 0 | 971 | 523 | 0 | 1,464 | 866 | 493 | 414 | 0 | 0 | 0 |
| 2000 | 0 | 607 | 0 | 0 | 487 | 0 | 0 | 0 | 0 | 0 | 0 | 0 |
| 2001 | 0 | 0 | 0 | 74 | 0 | 165 | 0 | 0 | 0 | 0 | 0 | 0 |
| 2002 | 0 | 0 | 287 | 0 | 0 | 369 | 0 | 234 | 0 | 0 | 198 | 0 |
| 2003 | 0 | 0 | 0 | 66 | 0 | 0 | 0 | 0 | 0 | 0 | 0 | 0 |
| 2004 | 884 | 250 | 394 | 392 | 313 | |||||||
| 2005 | 312 | 305 | 442 | |||||||||
| 2006 | 562 | 520 | 419 | 649 | ||||||||
| 2007 | 619 | 312 | 350 | 464 | 299 | |||||||
| 2008 | 291 | 108 | 60 | 817 | 300 | 1,378 | ||||||
| 2009 | 526 | 707 | 796 | 147 | 198 | 150 | 194 | |||||
| 2010 | 149 | 437 | 298 | |||||||||
| 2011 | 594 | 454 | 503 | |||||||||
| 2012 | 249 | 446 | ||||||||||
| 2013 | 498 | |||||||||||
| 2015 | 284 | 309 | ||||||||||
| 2016 | 950 | 401 | 854 | 148 | 598 | |||||||
| 2017 | 1,198 | 501 | 1,113 | 635 | 634 | 372 | 547 | 608 | ||||
| 2018 | 550 | 1,699 | 3,993 | 1,689 | 1,344 | 2,423 | 915 | 1,282 | 1,595 | 1,843 | 1,675 | 1,710 |
| 2019 | 882 | 1,038 | 341 | 665 | 500 | 497 | 2,138 | 1,046 | 2,530 | 1,279 | 850 | 1,670 |
| 2020 | 639 | 762 | 985 | |||||||||
| 2021 | 528 | 1,045 | 1,507 | 1,482 | 2,920 | 2,020 | 1,215 | 298 | 1,242 | 1,442 | ||
| 2022 | 2,077 | 497 | 727 | 6,215 | 6,837 | 5,790 | 7,839 | 5,717 | 5,486 | 4,835 | 5,869 | 4,097 |
| 2023 | 5,636 | 6,794 | 5,313 | 8,463 | 4,223 | 5,868 | 5,359 | 2,964 | 4,773 | 4,130 | 3,042 | 6,459 |
| 2024 | 4,257 | |||||||||||
| - = No Data Reported; -- = Not Applicable; NA = Not Available; W = Withheld to avoid disclosure of individual company data. |
| Release Date: 3/29/2024 |
| Next Release Date: 4/30/2024 |