|
Download Data (XLS File) |
|
||||||||
|
||||||||
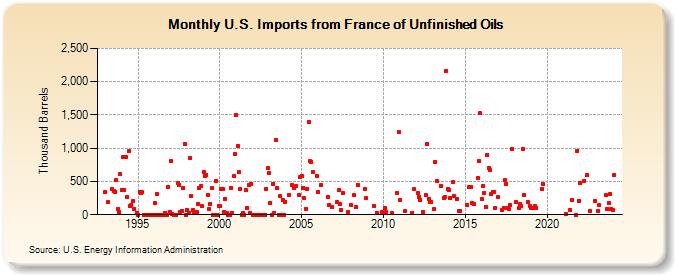
| U.S. Imports from France of Unfinished Oils (Thousand Barrels) | ||||||||
| Year | Jan | Feb | Mar | Apr | May | Jun | Jul | Aug | Sep | Oct | Nov | Dec |
|---|---|---|---|---|---|---|---|---|---|---|---|---|
| 1993 | 342 | 187 | 379 | 359 | 348 | 518 | 86 | 40 | 611 | |||
| 1994 | 378 | 861 | 372 | 867 | 267 | 952 | 124 | 148 | 201 | 86 | 31 | |
| 1995 | 0 | 344 | 322 | 338 | 0 | 0 | 0 | 0 | 0 | 0 | 0 | 0 |
| 1996 | 171 | 0 | 314 | 0 | 0 | 0 | 0 | 0 | 32 | 0 | 417 | 47 |
| 1997 | 803 | 11 | 0 | 0 | 0 | 474 | 449 | 43 | 54 | 409 | 1,066 | 1 |
| 1998 | 69 | 33 | 852 | 278 | 74 | 43 | 43 | 43 | 163 | 403 | 431 | 125 |
| 1999 | 637 | 578 | 603 | 300 | 86 | 165 | 397 | 0 | 0 | 514 | 0 | 135 |
| 2000 | 126 | 386 | 381 | 43 | 239 | 32 | 0 | 0 | 402 | 31 | 577 | 908 |
| 2001 | 1,499 | 1,039 | 640 | 391 | 0 | 33 | 0 | 375 | 104 | 441 | 31 | 467 |
| 2002 | 0 | 0 | 0 | 0 | 0 | 0 | 0 | 0 | 0 | 0 | 390 | 697 |
| 2003 | 634 | 177 | 0 | 469 | 31 | 1,118 | 404 | 0 | 277 | 0 | 226 | 0 |
| 2004 | 195 | 300 | 447 | 405 | 426 | 298 | 571 | |||||
| 2005 | 588 | 403 | 249 | 88 | 394 | 1,396 | 802 | 794 | 641 | 584 | ||
| 2006 | 344 | 445 | 270 | 151 | 115 | |||||||
| 2007 | 191 | 366 | 161 | 71 | 323 | 36 | ||||||
| 2008 | 148 | 296 | 113 | 451 | 381 | 245 | ||||||
| 2009 | 135 | 31 | 40 | |||||||||
| 2010 | 103 | 42 | 25 | 322 | 1,242 | |||||||
| 2011 | 223 | 52 | 33 | 379 | ||||||||
| 2012 | 322 | 273 | 221 | 39 | 291 | 1,066 | 240 | 187 | 188 | |||
| 2013 | 84 | 792 | 503 | 438 | 254 | 266 | 2,162 | 393 | ||||
| 2014 | 371 | 250 | 494 | 274 | 240 | 54 | 55 | |||||
| 2015 | 153 | 415 | 411 | 178 | 163 | 556 | 810 | 1,522 | ||||
| 2016 | 234 | 437 | 327 | 116 | 903 | 704 | 671 | 305 | 343 | 341 | 106 | |
| 2017 | 269 | 78 | 98 | 515 | 456 | 100 | 81 | 143 | 982 | |||
| 2018 | 191 | 102 | 156 | 125 | 995 | 299 | 186 | 135 | ||||
| 2019 | 106 | 101 | 128 | 103 | 386 | 458 | ||||||
| 2021 | 11 | 73 | 226 | 1 | 960 | 212 | ||||||
| 2022 | 481 | 511 | 599 | 52 | 212 | |||||||
| 2023 | 61 | 139 | 290 | 93 | 173 | 306 | 85 | |||||
| 2024 | 68 | |||||||||||
| - = No Data Reported; -- = Not Applicable; NA = Not Available; W = Withheld to avoid disclosure of individual company data. |
| Release Date: 3/29/2024 |
| Next Release Date: 4/30/2024 |