|
Download Data (XLS File) |
|
||||||||
|
||||||||
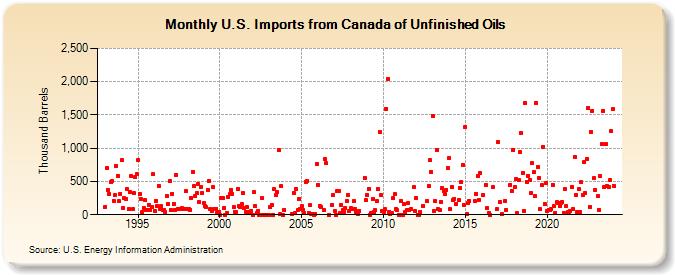
| U.S. Imports from Canada of Unfinished Oils (Thousand Barrels) | ||||||||
| Year | Jan | Feb | Mar | Apr | May | Jun | Jul | Aug | Sep | Oct | Nov | Dec |
|---|---|---|---|---|---|---|---|---|---|---|---|---|
| 1993 | 123 | 704 | 375 | 313 | 486 | 511 | 211 | 296 | 733 | 586 | 200 | 316 |
| 1994 | 820 | 103 | 249 | 240 | 382 | 83 | 336 | 586 | 83 | 321 | 562 | 608 |
| 1995 | 823 | 307 | 237 | 47 | 108 | 219 | 65 | 68 | 143 | 72 | 111 | 605 |
| 1996 | 63 | 211 | 129 | 436 | 86 | 127 | 66 | 68 | 39 | 279 | 162 | 506 |
| 1997 | 64 | 316 | 167 | 70 | 601 | 88 | 79 | 93 | 96 | 79 | 80 | 351 |
| 1998 | 83 | 86 | 77 | 249 | 644 | 429 | 276 | 319 | 467 | 188 | 416 | 327 |
| 1999 | 175 | 136 | 111 | 377 | 505 | 87 | 56 | 418 | 83 | 91 | 26 | 42 |
| 2000 | 1 | 254 | 246 | 103 | 1 | 29 | 266 | 305 | 378 | 317 | 112 | 43 |
| 2001 | 39 | 392 | 135 | 118 | 160 | 320 | 102 | 44 | 114 | 48 | 24 | 56 |
| 2002 | 0 | 338 | 130 | 25 | 63 | 0 | 0 | 253 | 0 | 0 | 0 | 0 |
| 2003 | 0 | 110 | 146 | 0 | 387 | 289 | 335 | 969 | 7 | 427 | 0 | 71 |
| 2004 | 7 | 325 | 20 | 388 | 65 | 241 | 83 | |||||
| 2005 | 132 | 74 | 27 | 497 | 504 | 22 | 139 | 16 | 16 | 2 | 4 | 768 |
| 2006 | 451 | 138 | 110 | 74 | 830 | 771 | 2 | 153 | 302 | |||
| 2007 | 53 | 1 | 356 | 349 | 31 | 143 | 65 | 40 | 101 | 204 | 295 | 60 |
| 2008 | 99 | 79 | 206 | 86 | 38 | 14 | 61 | 557 | 218 | |||
| 2009 | 299 | 391 | 1 | 30 | 237 | 38 | 69 | 203 | 384 | 1,248 | 290 | 49 |
| 2010 | 44 | 80 | 1,593 | 2,037 | 46 | 11 | 23 | 248 | 305 | 93 | 64 | 3 |
| 2011 | 1 | 205 | 1 | 154 | 34 | 67 | 171 | 67 | 86 | 412 | 50 | |
| 2012 | 254 | 1 | 3 | 48 | 135 | 203 | 436 | 817 | 642 | |||
| 2013 | 1,481 | 55 | 205 | 980 | 79 | 76 | 195 | 404 | 353 | 314 | 373 | 701 |
| 2014 | 851 | 82 | 420 | 214 | 243 | 164 | 220 | 396 | 491 | 753 | 146 | |
| 2015 | 1,324 | 6 | 182 | 209 | 207 | 313 | 581 | 227 | 630 | |||
| 2016 | 297 | 453 | 104 | 26 | 2 | 414 | 85 | |||||
| 2017 | 1,091 | 194 | 11 | 206 | 67 | 451 | 363 | 978 | ||||
| 2018 | 419 | 540 | 24 | 527 | 941 | 1,222 | 631 | 63 | 1,684 | 499 | 586 | 526 |
| 2019 | 321 | 770 | 637 | 274 | 1,676 | 718 | 559 | 79 | 440 | 1,021 | 158 | 472 |
| 2020 | 61 | 77 | 78 | 93 | 448 | 127 | 25 | 186 | 182 | 133 | 181 | 193 |
| 2021 | 30 | 380 | 129 | 36 | 43 | 60 | 420 | 82 | 866 | 290 | 36 | 385 |
| 2022 | 37 | 487 | 300 | 791 | 332 | 844 | 1,604 | 121 | 1,246 | 1,565 | 546 | 371 |
| 2023 | 281 | 76 | 575 | 1,059 | 1,564 | 419 | 1,069 | 432 | 424 | 518 | 1,256 | |
| 2024 | 1,584 | |||||||||||
| - = No Data Reported; -- = Not Applicable; NA = Not Available; W = Withheld to avoid disclosure of individual company data. |
| Release Date: 3/29/2024 |
| Next Release Date: 4/30/2024 |