|
Download Data (XLS File) |
|
||||||||
|
||||||||
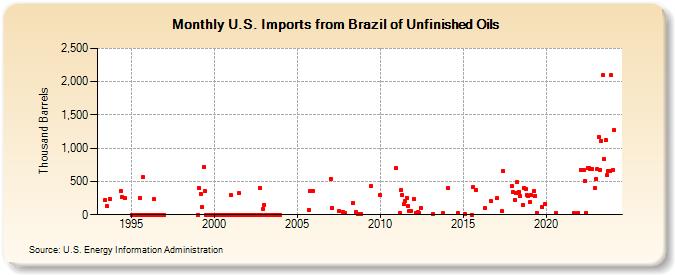
| U.S. Imports from Brazil of Unfinished Oils (Thousand Barrels) | ||||||||
| Year | Jan | Feb | Mar | Apr | May | Jun | Jul | Aug | Sep | Oct | Nov | Dec |
|---|---|---|---|---|---|---|---|---|---|---|---|---|
| 1993 | 220 | 131 | 240 | |||||||||
| 1994 | 358 | 260 | 249 | |||||||||
| 1995 | 0 | 0 | 0 | 0 | 0 | 0 | 250 | 0 | 565 | 0 | 0 | 0 |
| 1996 | 0 | 0 | 0 | 0 | 230 | 0 | 0 | 0 | 0 | 0 | 0 | 0 |
| 1999 | 0 | 404 | 315 | 117 | 719 | 350 | 0 | 0 | 0 | 0 | 0 | 0 |
| 2000 | 0 | 0 | 0 | 0 | 0 | 0 | 0 | 0 | 0 | 0 | 0 | 0 |
| 2001 | 295 | 0 | 0 | 0 | 0 | 0 | 325 | 0 | 0 | 0 | 0 | 0 |
| 2002 | 0 | 0 | 0 | 0 | 0 | 0 | 0 | 0 | 0 | 398 | 0 | 87 |
| 2003 | 150 | 0 | 0 | 0 | 0 | 0 | 0 | 0 | 0 | 0 | 0 | 0 |
| 2005 | 69 | 356 | 360 | |||||||||
| 2007 | 542 | 107 | 50 | 45 | 23 | |||||||
| 2008 | 177 | 40 | 18 | 14 | ||||||||
| 2009 | 425 | |||||||||||
| 2010 | 289 | 700 | ||||||||||
| 2011 | 25 | 369 | 301 | 161 | 206 | 258 | 136 | 50 | 50 | |||
| 2012 | 241 | 32 | 36 | 33 | 106 | |||||||
| 2013 | 15 | 23 | ||||||||||
| 2014 | 395 | 30 | ||||||||||
| 2015 | 8 | 3 | 410 | 366 | ||||||||
| 2016 | 96 | 200 | ||||||||||
| 2017 | 245 | 51 | 652 | 425 | ||||||||
| 2018 | 336 | 228 | 333 | 485 | 346 | 286 | 150 | 403 | 387 | 294 | 287 | |
| 2019 | 188 | 295 | 354 | 288 | 30 | 111 | 157 | |||||
| 2020 | 23 | |||||||||||
| 2021 | 27 | 30 | ||||||||||
| 2022 | 679 | 667 | 502 | 32 | 703 | 703 | 693 | 685 | 401 | |||
| 2023 | 543 | 685 | 1,175 | 673 | 1,111 | 2,098 | 838 | 1,118 | 592 | 664 | 650 | 2,094 |
| 2024 | 667 | |||||||||||
| - = No Data Reported; -- = Not Applicable; NA = Not Available; W = Withheld to avoid disclosure of individual company data. |
| Release Date: 3/29/2024 |
| Next Release Date: 4/30/2024 |