|
Download Data (XLS File) |
|
||||||||
|
||||||||
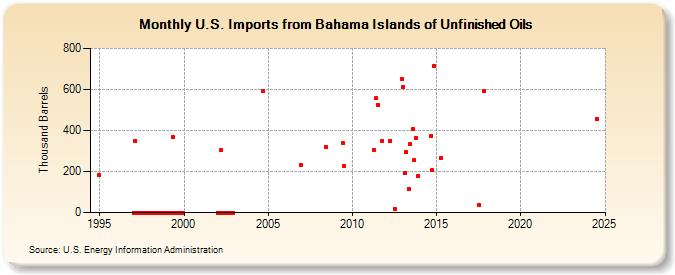
| U.S. Imports from Bahama Islands of Unfinished Oils (Thousand Barrels) | ||||||||
| Year | Jan | Feb | Mar | Apr | May | Jun | Jul | Aug | Sep | Oct | Nov | Dec |
|---|---|---|---|---|---|---|---|---|---|---|---|---|
| 1994 | 182 | |||||||||||
| 1997 | 0 | 350 | 0 | 0 | 0 | 0 | 0 | 0 | 0 | 0 | 0 | 0 |
| 1998 | 0 | 0 | 0 | 0 | 0 | 0 | 0 | 0 | 0 | 0 | 0 | 0 |
| 1999 | 0 | 0 | 0 | 0 | 368 | 0 | 0 | 0 | 0 | 0 | 0 | 0 |
| 2002 | 0 | 0 | 303 | 0 | 0 | 0 | 0 | 0 | 0 | 0 | 0 | 0 |
| 2004 | 592 | |||||||||||
| 2006 | 232 | |||||||||||
| 2008 | 320 | |||||||||||
| 2009 | 337 | 227 | ||||||||||
| 2011 | 307 | 558 | 526 | 349 | ||||||||
| 2012 | 351 | 18 | 652 | |||||||||
| 2013 | 612 | 192 | 293 | 115 | 334 | 409 | 256 | 365 | 180 | |||
| 2014 | 373 | 205 | 716 | |||||||||
| 2015 | 268 | |||||||||||
| 2017 | 36 | 592 | ||||||||||
| - = No Data Reported; -- = Not Applicable; NA = Not Available; W = Withheld to avoid disclosure of individual company data. |
| Release Date: 3/29/2024 |
| Next Release Date: 4/30/2024 |