|
Download Data (XLS File) |
|
||||||||
|
||||||||
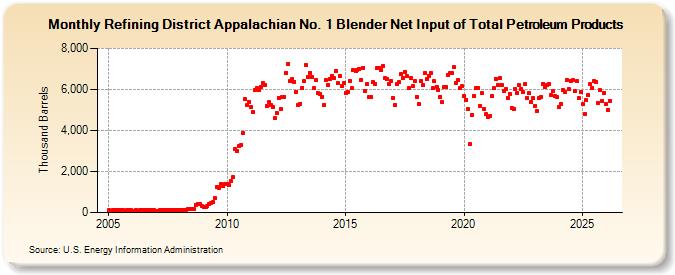
| Refining District Appalachian No. 1 Blender Net Input of Total Petroleum Products (Thousand Barrels) | ||||||||
| Year | Jan | Feb | Mar | Apr | May | Jun | Jul | Aug | Sep | Oct | Nov | Dec |
|---|---|---|---|---|---|---|---|---|---|---|---|---|
| 2005 | 101 | 97 | 110 | 103 | 112 | 113 | 117 | 121 | 97 | 103 | 103 | 108 |
| 2006 | 92 | 91 | 106 | 100 | 105 | 107 | 118 | 113 | 101 | 108 | 105 | 108 |
| 2007 | 94 | 98 | 102 | 102 | 115 | 110 | 112 | 117 | 107 | 110 | 104 | 110 |
| 2008 | 106 | 112 | 138 | 138 | 162 | 170 | 193 | 193 | 352 | 425 | 418 | 342 |
| 2009 | 294 | 249 | 330 | 415 | 473 | 519 | 689 | 1,248 | 1,189 | 1,401 | 1,282 | 1,399 |
| 2010 | 1,406 | 1,329 | 1,534 | 1,713 | 3,095 | 3,009 | 3,253 | 3,297 | 3,858 | 5,511 | 5,243 | 5,406 |
| 2011 | 5,136 | 4,883 | 5,980 | 6,078 | 5,992 | 6,141 | 6,309 | 6,204 | 5,217 | 5,374 | 5,242 | 5,145 |
| 2012 | 4,620 | 4,844 | 5,588 | 5,051 | 5,654 | 5,654 | 6,815 | 7,255 | 6,387 | 6,485 | 6,379 | 5,891 |
| 2013 | 5,241 | 5,293 | 6,090 | 6,392 | 7,185 | 6,594 | 6,820 | 6,594 | 6,046 | 6,453 | 5,802 | 5,760 |
| 2014 | 5,643 | 5,252 | 6,455 | 6,226 | 6,498 | 6,668 | 6,544 | 6,897 | 6,297 | 6,646 | 6,144 | 6,310 |
| 2015 | 5,842 | 5,866 | 6,399 | 6,052 | 6,939 | 6,910 | 6,964 | 6,996 | 6,460 | 7,049 | 5,926 | 6,257 |
| 2016 | 5,634 | 5,625 | 6,341 | 6,289 | 7,027 | 7,061 | 6,957 | 7,143 | 6,535 | 6,515 | 6,267 | 6,413 |
| 2017 | 5,598 | 5,247 | 6,284 | 6,349 | 6,730 | 6,550 | 6,842 | 6,642 | 6,056 | 6,552 | 6,167 | 6,392 |
| 2018 | 5,634 | 5,280 | 6,421 | 6,198 | 6,778 | 6,506 | 6,655 | 6,808 | 6,061 | 6,398 | 6,132 | 5,973 |
| 2019 | 5,650 | 5,366 | 6,119 | 6,115 | 6,706 | 6,784 | 6,797 | 7,093 | 6,327 | 6,448 | 6,065 | 6,152 |
| 2020 | 5,667 | 5,509 | 5,054 | 3,323 | 4,778 | 5,703 | 6,064 | 6,064 | 5,216 | 5,830 | 5,066 | 4,785 |
| 2021 | 4,662 | 4,697 | 5,659 | 6,057 | 6,531 | 6,197 | 6,557 | 6,232 | 5,939 | 6,009 | 5,572 | 5,787 |
| 2022 | 5,089 | 5,064 | 5,999 | 5,841 | 6,193 | 6,019 | 5,868 | 6,267 | 5,577 | 5,812 | 5,393 | 5,562 |
| 2023 | 5,135 | 4,870 | 5,472 | 5,541 | 6,173 | 5,981 | 6,198 | 6,280 | 5,806 | 5,908 | 5,674 | 5,616 |
| 2024 | 5,120 | |||||||||||
| - = No Data Reported; -- = Not Applicable; NA = Not Available; W = Withheld to avoid disclosure of individual company data. |
| Release Date: 3/29/2024 |
| Next Release Date: 4/30/2024 |