|
Download Data (XLS File) |
|
||||||||
|
||||||||
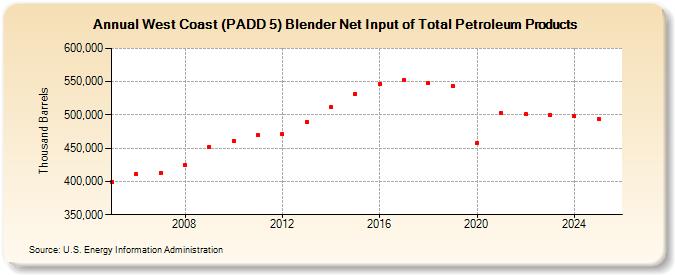
| West Coast (PADD 5) Blender Net Input of Total Petroleum Products (Thousand Barrels) | ||||||||
| Decade | Year-0 | Year-1 | Year-2 | Year-3 | Year-4 | Year-5 | Year-6 | Year-7 | Year-8 | Year-9 |
|---|---|---|---|---|---|---|---|---|---|---|
| 2000's | 399,481 | 410,931 | 412,820 | 424,065 | 451,681 | |||||
| 2010's | 460,810 | 469,663 | 470,770 | 490,089 | 511,553 | 531,609 | 546,850 | 552,131 | 548,347 | 543,741 |
| 2020's | 458,125 | 502,591 | 500,993 | 500,316 |
| - = No Data Reported; -- = Not Applicable; NA = Not Available; W = Withheld to avoid disclosure of individual company data. |
| Release Date: 3/29/2024 |
| Next Release Date: 8/30/2024 |
Referring Pages: