|
Download Data (XLS File) |
|
||||||||
|
||||||||
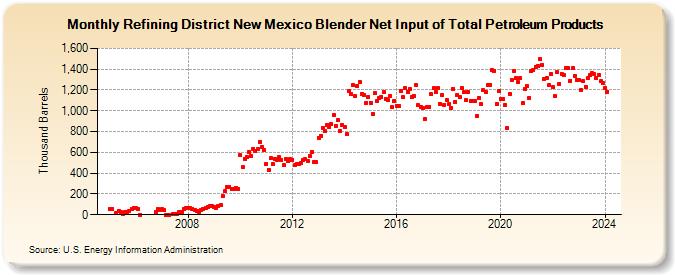
| Refining District New Mexico Blender Net Input of Total Petroleum Products (Thousand Barrels) | ||||||||
| Year | Jan | Feb | Mar | Apr | May | Jun | Jul | Aug | Sep | Oct | Nov | Dec |
|---|---|---|---|---|---|---|---|---|---|---|---|---|
| 2005 | 55 | 58 | 13 | 36 | 23 | 8 | 24 | 24 | 37 | 58 | 62 | |
| 2006 | 60 | 53 | 0 | 30 | 54 | 49 | ||||||
| 2007 | 52 | 45 | 0 | 0 | 5 | 6 | 7 | 22 | 25 | 58 | 62 | |
| 2008 | 60 | 63 | 58 | 47 | 40 | 30 | 48 | 53 | 61 | 75 | 82 | 85 |
| 2009 | 75 | 64 | 84 | 92 | 177 | 224 | 268 | 271 | 248 | 252 | 260 | 252 |
| 2010 | 572 | 458 | 539 | 556 | 604 | 563 | 636 | 610 | 632 | 699 | 654 | 621 |
| 2011 | 488 | 431 | 543 | 485 | 540 | 531 | 551 | 526 | 474 | 538 | 513 | 539 |
| 2012 | 530 | 475 | 487 | 488 | 496 | 522 | 532 | 520 | 567 | 603 | 504 | 507 |
| 2013 | 742 | 760 | 837 | 802 | 865 | 839 | 868 | 961 | 858 | 908 | 809 | 862 |
| 2014 | 839 | 780 | 1,187 | 1,161 | 1,245 | 1,139 | 1,241 | 1,276 | 1,165 | 1,156 | 1,079 | 1,134 |
| 2015 | 1,079 | 970 | 1,175 | 1,095 | 1,127 | 1,136 | 1,177 | 1,115 | 1,100 | 1,143 | 1,035 | 1,098 |
| 2016 | 1,048 | 1,048 | 1,187 | 1,132 | 1,216 | 1,183 | 1,209 | 1,130 | 1,140 | 1,248 | 1,051 | 1,035 |
| 2017 | 1,028 | 920 | 1,032 | 1,040 | 1,157 | 1,216 | 1,176 | 1,218 | 1,068 | 1,154 | 1,058 | 1,101 |
| 2018 | 1,064 | 1,027 | 1,212 | 1,089 | 1,150 | 1,133 | 1,222 | 1,185 | 1,099 | 1,185 | 1,094 | 1,096 |
| 2019 | 1,098 | 952 | 1,125 | 1,063 | 1,197 | 1,176 | 1,247 | 1,249 | 1,390 | 1,383 | 1,066 | 1,188 |
| 2020 | 1,114 | 1,111 | 1,056 | 832 | 1,165 | 1,293 | 1,382 | 1,315 | 1,272 | 1,311 | 1,070 | 1,214 |
| 2021 | 1,237 | 1,123 | 1,382 | 1,395 | 1,424 | 1,435 | 1,495 | 1,443 | 1,310 | 1,317 | 1,246 | 1,355 |
| 2022 | 1,225 | 1,140 | 1,371 | 1,260 | 1,357 | 1,342 | 1,414 | 1,409 | 1,291 | 1,407 | 1,335 | 1,297 |
| 2023 | 1,298 | 1,200 | 1,286 | 1,232 | 1,315 | 1,343 | 1,361 | 1,349 | 1,313 | 1,345 | 1,282 | 1,268 |
| 2024 | 1,220 | |||||||||||
| - = No Data Reported; -- = Not Applicable; NA = Not Available; W = Withheld to avoid disclosure of individual company data. |
| Release Date: 3/29/2024 |
| Next Release Date: 4/30/2024 |