|
Download Data (XLS File) |
|
||||||||
|
||||||||
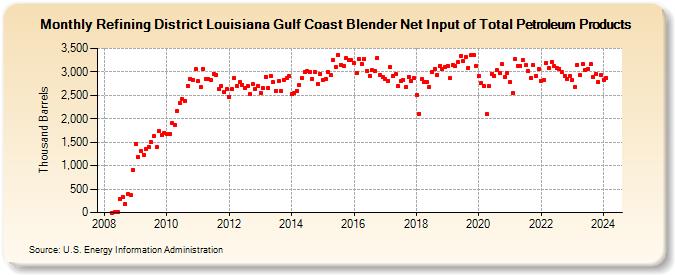
| Refining District Louisiana Gulf Coast Blender Net Input of Total Petroleum Products (Thousand Barrels) | ||||||||
| Year | Jan | Feb | Mar | Apr | May | Jun | Jul | Aug | Sep | Oct | Nov | Dec |
|---|---|---|---|---|---|---|---|---|---|---|---|---|
| 2008 | 1 | 2 | 14 | 292 | 340 | 183 | 393 | 383 | 908 | |||
| 2009 | 1,464 | 1,181 | 1,303 | 1,237 | 1,365 | 1,405 | 1,498 | 1,626 | 1,397 | 1,729 | 1,644 | 1,705 |
| 2010 | 1,680 | 1,674 | 1,913 | 1,877 | 2,161 | 2,336 | 2,417 | 2,382 | 2,704 | 2,854 | 2,827 | 3,053 |
| 2011 | 2,796 | 2,682 | 3,066 | 2,856 | 2,852 | 2,823 | 2,963 | 2,928 | 2,629 | 2,703 | 2,563 | 2,627 |
| 2012 | 2,470 | 2,630 | 2,867 | 2,705 | 2,779 | 2,728 | 2,660 | 2,692 | 2,522 | 2,736 | 2,639 | 2,705 |
| 2013 | 2,551 | 2,652 | 2,896 | 2,654 | 2,919 | 2,776 | 2,596 | 2,808 | 2,586 | 2,834 | 2,872 | 2,912 |
| 2014 | 2,532 | 2,555 | 2,602 | 2,716 | 2,868 | 2,997 | 3,015 | 3,005 | 2,856 | 3,000 | 2,741 | 2,955 |
| 2015 | 2,828 | 2,853 | 2,999 | 2,933 | 3,253 | 3,108 | 3,361 | 3,148 | 3,127 | 3,287 | 3,250 | 3,247 |
| 2016 | 3,193 | 2,978 | 3,271 | 3,177 | 3,272 | 3,010 | 2,918 | 3,030 | 3,023 | 3,301 | 2,938 | 2,889 |
| 2017 | 2,841 | 2,814 | 3,108 | 2,911 | 2,945 | 2,698 | 2,795 | 2,834 | 2,680 | 2,894 | 2,812 | 2,870 |
| 2018 | 2,510 | 2,111 | 2,837 | 2,776 | 2,789 | 2,679 | 2,994 | 3,063 | 2,935 | 3,134 | 3,063 | 3,103 |
| 2019 | 3,133 | 2,862 | 3,152 | 3,122 | 3,200 | 3,329 | 3,241 | 3,324 | 3,087 | 3,352 | 3,362 | 3,121 |
| 2020 | 2,908 | 2,754 | 2,691 | 2,099 | 2,693 | 2,959 | 2,918 | 3,029 | 2,973 | 3,167 | 2,895 | 2,977 |
| 2021 | 2,787 | 2,552 | 3,275 | 3,133 | 3,131 | 3,263 | 3,142 | 3,016 | 2,874 | 3,142 | 2,921 | 3,051 |
| 2022 | 2,801 | 2,820 | 3,190 | 3,085 | 3,215 | 3,117 | 3,072 | 3,067 | 2,987 | 2,919 | 2,853 | 2,914 |
| 2023 | 2,819 | 2,684 | 3,156 | 2,932 | 3,177 | 3,046 | 3,070 | 3,161 | 2,892 | 2,962 | 2,786 | 2,938 |
| 2024 | 2,836 | |||||||||||
| - = No Data Reported; -- = Not Applicable; NA = Not Available; W = Withheld to avoid disclosure of individual company data. |
| Release Date: 3/29/2024 |
| Next Release Date: 4/30/2024 |