|
Download Data (XLS File) |
|
||||||||
|
||||||||
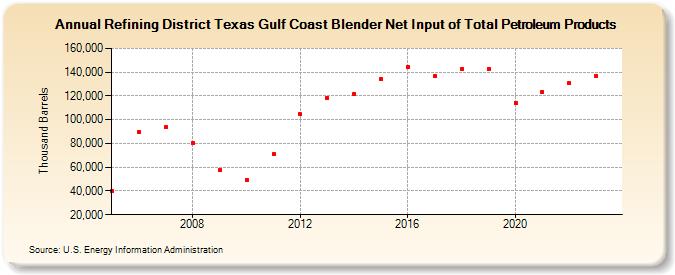
| Refining District Texas Gulf Coast Blender Net Input of Total Petroleum Products (Thousand Barrels) | ||||||||
| Decade | Year-0 | Year-1 | Year-2 | Year-3 | Year-4 | Year-5 | Year-6 | Year-7 | Year-8 | Year-9 |
|---|---|---|---|---|---|---|---|---|---|---|
| 2000's | 39,671 | 89,427 | 93,675 | 80,432 | 57,297 | |||||
| 2010's | 49,271 | 71,015 | 104,381 | 118,604 | 121,979 | 134,134 | 144,135 | 136,847 | 142,795 | 142,707 |
| 2020's | 114,450 | 123,519 | 130,599 | 136,472 |
| - = No Data Reported; -- = Not Applicable; NA = Not Available; W = Withheld to avoid disclosure of individual company data. |
| Release Date: 3/29/2024 |
| Next Release Date: 8/30/2024 |