|
Download Data (XLS File) |
|
||||||||
|
||||||||
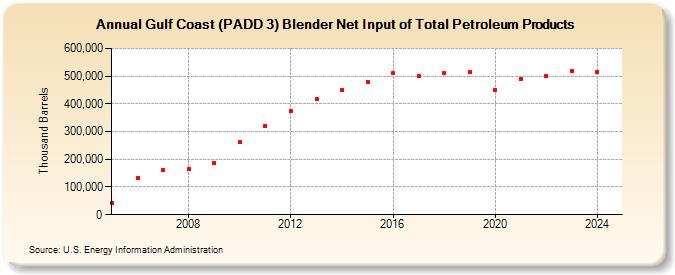
| Gulf Coast (PADD 3) Blender Net Input of Total Petroleum Products (Thousand Barrels) | ||||||||
| Decade | Year-0 | Year-1 | Year-2 | Year-3 | Year-4 | Year-5 | Year-6 | Year-7 | Year-8 | Year-9 |
|---|---|---|---|---|---|---|---|---|---|---|
| 2000's | 41,605 | 133,562 | 159,620 | 163,888 | 187,182 | |||||
| 2010's | 261,109 | 320,979 | 372,369 | 418,075 | 451,377 | 479,588 | 509,578 | 501,957 | 510,917 | 516,472 |
| 2020's | 450,342 | 490,461 | 501,648 | 517,008 |
| - = No Data Reported; -- = Not Applicable; NA = Not Available; W = Withheld to avoid disclosure of individual company data. |
| Release Date: 8/30/2024 |
| Next Release Date: 8/29/2025 |
Referring Pages: