|
Download Data (XLS File) |
|
||||||||
|
||||||||
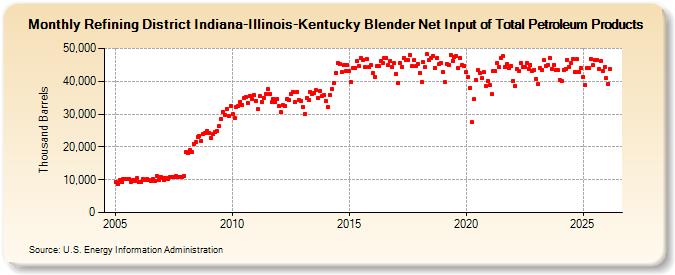
| Refining District Indiana-Illinois-Kentucky Blender Net Input of Total Petroleum Products (Thousand Barrels) | ||||||||
| Year | Jan | Feb | Mar | Apr | May | Jun | Jul | Aug | Sep | Oct | Nov | Dec |
|---|---|---|---|---|---|---|---|---|---|---|---|---|
| 2005 | 9,201 | 8,717 | 9,835 | 9,392 | 10,097 | 10,148 | 10,121 | 10,259 | 9,454 | 10,066 | 9,733 | 10,386 |
| 2006 | 9,383 | 9,203 | 10,201 | 9,877 | 10,188 | 9,833 | 9,730 | 10,148 | 9,536 | 11,213 | 10,008 | 10,969 |
| 2007 | 10,636 | 9,863 | 10,652 | 10,083 | 10,780 | 10,732 | 10,758 | 11,046 | 10,792 | 10,957 | 10,948 | 11,088 |
| 2008 | 18,502 | 18,033 | 18,907 | 18,464 | 20,968 | 21,413 | 23,101 | 23,339 | 21,725 | 23,850 | 24,251 | 24,919 |
| 2009 | 24,289 | 22,720 | 23,789 | 24,510 | 24,987 | 26,270 | 28,346 | 30,778 | 29,684 | 31,678 | 29,367 | 32,436 |
| 2010 | 29,950 | 28,683 | 32,119 | 32,503 | 33,812 | 32,908 | 35,033 | 35,123 | 33,417 | 35,515 | 34,534 | 35,936 |
| 2011 | 34,120 | 31,459 | 35,406 | 33,795 | 34,990 | 36,110 | 37,543 | 36,205 | 33,567 | 34,563 | 33,608 | 34,497 |
| 2012 | 32,322 | 30,503 | 32,667 | 32,535 | 34,662 | 34,319 | 36,192 | 36,841 | 33,603 | 36,795 | 34,327 | 34,043 |
| 2013 | 32,250 | 30,058 | 34,837 | 34,242 | 36,783 | 35,983 | 36,553 | 37,222 | 35,017 | 37,069 | 35,353 | 35,723 |
| 2014 | 33,839 | 32,052 | 35,821 | 37,730 | 39,429 | 42,508 | 45,614 | 45,183 | 42,806 | 44,807 | 43,020 | 44,956 |
| 2015 | 42,973 | 39,621 | 43,990 | 44,044 | 46,063 | 44,510 | 47,114 | 46,571 | 44,226 | 46,722 | 44,296 | 44,834 |
| 2016 | 42,552 | 41,424 | 44,522 | 44,608 | 46,030 | 45,691 | 46,952 | 47,055 | 45,059 | 46,183 | 44,392 | 45,537 |
| 2017 | 42,324 | 39,513 | 45,633 | 44,403 | 47,191 | 46,579 | 46,528 | 47,953 | 44,510 | 46,359 | 44,628 | 45,369 |
| 2018 | 42,610 | 39,838 | 45,821 | 44,277 | 48,145 | 46,319 | 47,047 | 47,807 | 44,129 | 47,187 | 45,131 | 45,698 |
| 2019 | 42,675 | 39,653 | 45,361 | 44,944 | 47,992 | 46,293 | 47,245 | 47,723 | 44,094 | 47,069 | 44,900 | 44,662 |
| 2020 | 42,661 | 41,178 | 38,055 | 27,486 | 34,459 | 40,400 | 43,314 | 42,570 | 40,940 | 42,690 | 38,592 | 40,023 |
| 2021 | 38,783 | 35,957 | 43,011 | 43,028 | 45,519 | 44,277 | 47,173 | 47,538 | 44,424 | 45,199 | 43,901 | 44,653 |
| 2022 | 40,132 | 38,493 | 43,731 | 43,086 | 45,648 | 44,429 | 44,469 | 45,622 | 43,679 | 44,884 | 43,240 | 43,424 |
| 2023 | 40,634 | 39,280 | 43,990 | 43,523 | 46,351 | 44,726 | 44,987 | 47,106 | 43,837 | 45,055 | 43,285 | 43,355 |
| 2024 | 40,251 | 39,762 | ||||||||||
| - = No Data Reported; -- = Not Applicable; NA = Not Available; W = Withheld to avoid disclosure of individual company data. |
| Release Date: 4/30/2024 |
| Next Release Date: 5/31/2024 |