|
Download Data (XLS File) |
|
||||||||
|
||||||||
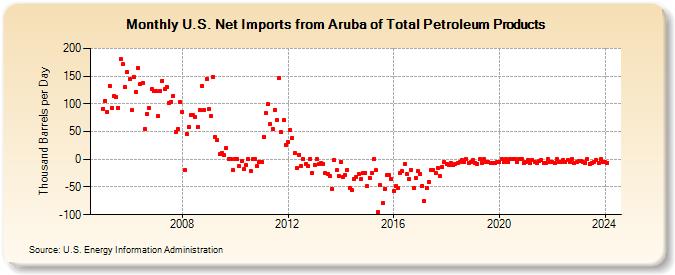
| U.S. Net Imports from Aruba of Total Petroleum Products (Thousand Barrels per Day) | ||||||||
| Year | Jan | Feb | Mar | Apr | May | Jun | Jul | Aug | Sep | Oct | Nov | Dec |
|---|---|---|---|---|---|---|---|---|---|---|---|---|
| 2005 | 91 | 106 | 85 | 133 | 93 | 114 | 112 | 93 | 180 | 171 | 130 | 157 |
| 2006 | 144 | 88 | 149 | 121 | 165 | 136 | 138 | 55 | 82 | 93 | 126 | 123 |
| 2007 | 123 | 78 | 123 | 142 | 126 | 131 | 102 | 104 | 115 | 50 | 54 | 103 |
| 2008 | 86 | -20 | 45 | 59 | 79 | 79 | 76 | 59 | 89 | 133 | 89 | 144 |
| 2009 | 90 | 78 | 149 | 40 | 34 | 9 | 12 | 7 | 20 | 0 | 0 | -20 |
| 2010 | 0 | 0 | -13 | -3 | -18 | -11 | 0 | -21 | 0 | 0 | -13 | -5 |
| 2011 | -5 | 41 | 83 | 99 | 63 | 55 | 89 | 70 | 147 | 49 | 70 | 25 |
| 2012 | 32 | 53 | 39 | 11 | -16 | 8 | -12 | 0 | -9 | -12 | 1 | -24 |
| 2013 | -10 | 0 | -9 | -6 | -8 | -25 | -26 | -30 | -53 | -1 | -20 | -30 |
| 2014 | -5 | -32 | -28 | -19 | -52 | -56 | -36 | -32 | -27 | -36 | -25 | -24 |
| 2015 | -49 | -33 | -25 | 0 | -20 | -96 | -46 | -79 | -53 | -29 | -28 | -35 |
| 2016 | -57 | -49 | -52 | -25 | -22 | -8 | -27 | -36 | -19 | -51 | -33 | -22 |
| 2017 | -27 | -48 | -76 | -51 | -41 | -20 | -19 | -24 | -15 | -31 | -14 | -5 |
| 2018 | -9 | -11 | -6 | -11 | -8 | -6 | -5 | -1 | -5 | 0 | -6 | -5 |
| 2019 | -2 | -6 | -8 | 0 | -6 | 0 | -5 | -5 | -6 | -6 | -6 | -5 |
| 2020 | -5 | 0 | -5 | 0 | -5 | 0 | 0 | 0 | -5 | 0 | 0 | -6 |
| 2021 | -5 | -1 | -6 | -1 | -5 | -6 | -4 | -1 | -6 | -6 | 0 | -5 |
| 2022 | -5 | -7 | 0 | -5 | -5 | -1 | -5 | -1 | -5 | 0 | -6 | -5 |
| 2023 | -3 | -3 | -5 | -6 | 0 | -8 | -6 | -5 | -1 | -6 | 0 | -5 |
| 2024 | -5 | |||||||||||
| - = No Data Reported; -- = Not Applicable; NA = Not Available; W = Withheld to avoid disclosure of individual company data. |
| Release Date: 3/29/2024 |
| Next Release Date: 4/30/2024 |