|
Download Data (XLS File) |
|
||||||||
|
||||||||
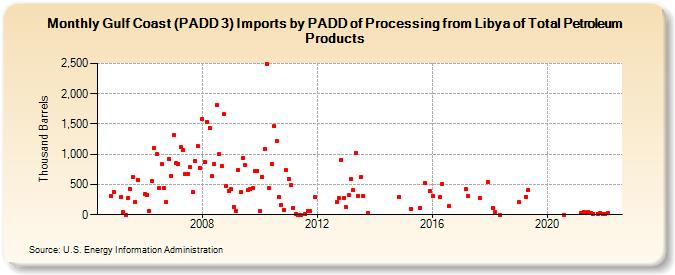
| Gulf Coast (PADD 3) Imports by PADD of Processing from Libya of Total Petroleum Products (Thousand Barrels) | ||||||||
| Year | Jan | Feb | Mar | Apr | May | Jun | Jul | Aug | Sep | Oct | Nov | Dec |
|---|---|---|---|---|---|---|---|---|---|---|---|---|
| 2004 | 312 | 374 | ||||||||||
| 2005 | 292 | 45 | 1 | 280 | 433 | 621 | 216 | 577 | ||||
| 2006 | 342 | 331 | 68 | 553 | 1,107 | 1,002 | 439 | 837 | 440 | 213 | 918 | 644 |
| 2007 | 1,311 | 858 | 841 | 1,114 | 1,063 | 667 | 675 | 784 | 379 | 884 | 1,129 | 764 |
| 2008 | 1,583 | 872 | 1,531 | 1,435 | 639 | 844 | 1,811 | 996 | 805 | 1,657 | 470 | 400 |
| 2009 | 424 | 134 | 61 | 747 | 374 | 936 | 816 | 407 | 417 | 437 | 721 | 725 |
| 2010 | 68 | 629 | 1,080 | 2,486 | 443 | 844 | 1,470 | 1,218 | 293 | 158 | 86 | 738 |
| 2011 | 597 | 489 | 107 | 18 | 1 | 1 | 20 | 59 | 59 | 287 | ||
| 2012 | 212 | 280 | 908 | 281 | ||||||||
| 2013 | 120 | 324 | 593 | 403 | 1,028 | 312 | 622 | 307 | 28 | |||
| 2014 | 291 | |||||||||||
| 2015 | 100 | 117 | 528 | 385 | ||||||||
| 2016 | 310 | 292 | 508 | 148 | ||||||||
| 2017 | 423 | 302 | 272 | 541 | ||||||||
| 2018 | 111 | 38 | 2 | |||||||||
| 2019 | 205 | 298 | 413 | |||||||||
| 2020 | 1 | |||||||||||
| 2021 | 21 | 48 | 27 | 41 | 21 | 18 | 12 | 27 | 18 | |||
| 2022 | 16 | 30 | ||||||||||
| - = No Data Reported; -- = Not Applicable; NA = Not Available; W = Withheld to avoid disclosure of individual company data. |
| Release Date: 8/30/2024 |
| Next Release Date: 9/30/2024 |