|
Download Data (XLS File) |
|
||||||||
|
||||||||
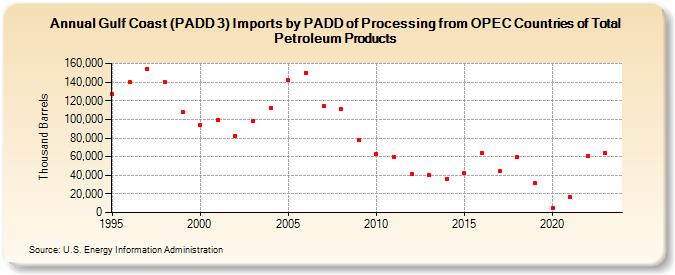
| Gulf Coast (PADD 3) Imports by PADD of Processing from OPEC Countries of Total Petroleum Products (Thousand Barrels) | ||||||||
| Decade | Year-0 | Year-1 | Year-2 | Year-3 | Year-4 | Year-5 | Year-6 | Year-7 | Year-8 | Year-9 |
|---|---|---|---|---|---|---|---|---|---|---|
| 1990's | 126,913 | 139,999 | 154,458 | 140,088 | 107,533 | |||||
| 2000's | 94,050 | 99,648 | 82,216 | 98,761 | 112,157 | 142,229 | 150,310 | 114,823 | 110,707 | 77,602 |
| 2010's | 63,385 | 60,149 | 41,372 | 40,011 | 36,329 | 42,413 | 63,842 | 44,854 | 59,436 | 31,231 |
| 2020's | 5,136 | 17,206 | 60,973 | 63,392 |
| - = No Data Reported; -- = Not Applicable; NA = Not Available; W = Withheld to avoid disclosure of individual company data. |
| Release Date: 8/30/2024 |
| Next Release Date: 8/29/2025 |