|
Download Data (XLS File) |
|
||||||||
|
||||||||
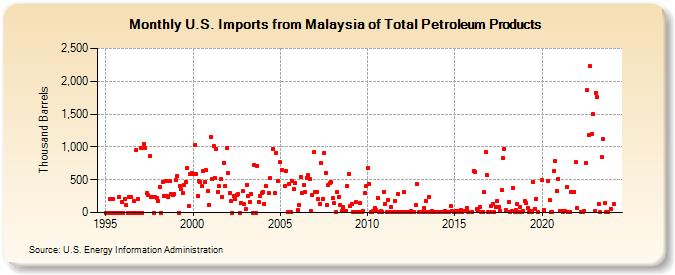
| U.S. Imports from Malaysia of Total Petroleum Products (Thousand Barrels) | ||||||||
| Year | Jan | Feb | Mar | Apr | May | Jun | Jul | Aug | Sep | Oct | Nov | Dec |
|---|---|---|---|---|---|---|---|---|---|---|---|---|
| 1995 | 0 | 0 | 0 | 201 | 0 | 199 | 0 | 0 | 0 | 235 | 0 | 164 |
| 1996 | 0 | 203 | 120 | 0 | 230 | 241 | 0 | 170 | 0 | 957 | 213 | 0 |
| 1997 | 988 | 0 | 1,037 | 988 | 291 | 266 | 861 | 241 | 233 | 0 | 230 | 229 |
| 1998 | 173 | 396 | 0 | 470 | 253 | 477 | 249 | 230 | 474 | 290 | 263 | 282 |
| 1999 | 489 | 557 | 0 | 403 | 353 | 296 | 425 | 466 | 678 | 96 | 593 | 599 |
| 2000 | 589 | 1,023 | 587 | 255 | 479 | 459 | 400 | 636 | 463 | 641 | 323 | 122 |
| 2001 | 1,150 | 513 | 1,006 | 529 | 968 | 319 | 397 | 515 | 242 | 762 | 407 | 982 |
| 2002 | 602 | 295 | 178 | 0 | 259 | 211 | 266 | 276 | 0 | 141 | 323 | 123 |
| 2003 | 54 | 425 | 249 | 158 | 279 | 0 | 721 | 0 | 716 | 167 | 256 | 300 |
| 2004 | 311 | 135 | 409 | 295 | 523 | 971 | 291 | 912 | 477 | |||
| 2005 | 764 | 651 | 409 | 637 | 8 | 439 | 8 | 480 | 358 | 447 | ||
| 2006 | 36 | 110 | 546 | 303 | 418 | 317 | 531 | 578 | 517 | 17 | 264 | 922 |
| 2007 | 317 | 320 | 199 | 133 | 749 | 205 | 910 | 603 | 119 | 417 | 443 | 461 |
| 2008 | 215 | 139 | 10 | 312 | 237 | 108 | 31 | 82 | 18 | 29 | 406 | 593 |
| 2009 | 99 | 124 | 15 | 1 | 155 | 3 | 6 | 140 | 5 | 20 | 295 | 409 |
| 2010 | 671 | 436 | 7 | 1 | 24 | 68 | 36 | 219 | 5 | 22 | 15 | 319 |
| 2011 | 132 | 6 | 194 | 9 | 90 | 3 | 9 | 182 | 11 | 285 | 1 | |
| 2012 | 14 | 314 | 14 | 7 | 9 | 3 | 31 | 13 | 4 | 117 | 432 | 1 |
| 2013 | 8 | 8 | 77 | 183 | 4 | 243 | 7 | 22 | 6 | 6 | 6 | |
| 2014 | 8 | 16 | 12 | 6 | 5 | 29 | 6 | 7 | 6 | 94 | 22 | 13 |
| 2015 | 9 | 21 | 6 | 17 | 40 | 7 | 23 | 26 | 74 | 6 | ||
| 2016 | 2 | 633 | 621 | 48 | 25 | 88 | 9 | 9 | 312 | 929 | 565 | 10 |
| 2017 | 12 | 97 | 124 | 8 | 82 | 180 | 85 | 21 | 346 | 830 | 973 | 44 |
| 2018 | 163 | 11 | 24 | 381 | 12 | 33 | 123 | 10 | 83 | 7 | 18 | |
| 2019 | 172 | 139 | 74 | 4 | 21 | 3 | 470 | 60 | 210 | 3 | ||
| 2020 | 490 | 33 | 486 | 190 | 8 | 15 | 630 | 780 | 327 | 514 | ||
| 2021 | 18 | 22 | 12 | 20 | 18 | 392 | 10 | 6 | 315 | 318 | 767 | |
| 2022 | 65 | 4 | 13 | 26 | 754 | 1,859 | 1,177 | 2,226 | 1,202 | 1,499 | ||
| 2023 | 27 | 1,823 | 1,757 | 123 | 4 | 839 | 1,116 | 138 | 6 | 1 | 61 | |
| 2024 | 131 | 250 | 62 | 15 | 123 | |||||||
| - = No Data Reported; -- = Not Applicable; NA = Not Available; W = Withheld to avoid disclosure of individual company data. |
| Release Date: 8/30/2024 |
| Next Release Date: 9/30/2024 |