|
Download Data (XLS File) |
|
||||||||
|
||||||||
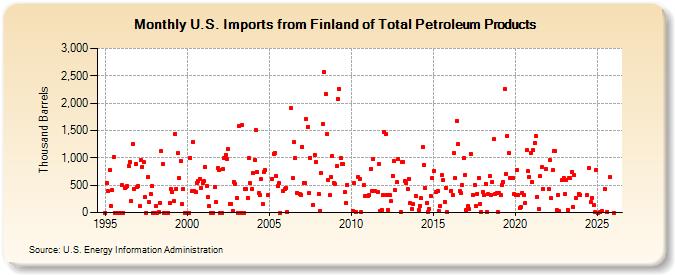
| U.S. Imports from Finland of Total Petroleum Products (Thousand Barrels) | ||||||||
| Year | Jan | Feb | Mar | Apr | May | Jun | Jul | Aug | Sep | Oct | Nov | Dec |
|---|---|---|---|---|---|---|---|---|---|---|---|---|
| 1995 | 0 | 532 | 385 | 773 | 118 | 413 | 1,013 | 0 | 0 | 0 | 0 | 0 |
| 1996 | 495 | 0 | 443 | 466 | 477 | 855 | 925 | 203 | 1,252 | 435 | 883 | 461 |
| 1997 | 488 | 111 | 962 | 839 | 917 | 281 | 0 | 657 | 186 | 337 | 484 | 0 |
| 1998 | 0 | 114 | 0 | 14 | 183 | 1,123 | 885 | 0 | 0 | 0 | 0 | 173 |
| 1999 | 425 | 376 | 204 | 1,441 | 438 | 1,084 | 626 | 939 | 149 | 435 | 0 | 0 |
| 2000 | 0 | 0 | 997 | 391 | 1,290 | 398 | 378 | 546 | 571 | 616 | 457 | 547 |
| 2001 | 569 | 830 | 484 | 290 | 119 | 0 | 0 | 0 | 475 | 191 | 811 | 781 |
| 2002 | 0 | 0 | 789 | 1,001 | 1,060 | 987 | 1,161 | 163 | 157 | 33 | 559 | 528 |
| 2003 | 269 | 0 | 1,579 | 0 | 1,598 | 0 | 437 | 432 | 275 | 990 | 538 | 439 |
| 2004 | 721 | 967 | 1,505 | 742 | 351 | 315 | 609 | 154 | 745 | 769 | 315 | |
| 2005 | 621 | 1,077 | 1,095 | 665 | 485 | 538 | 1 | 385 | 439 | |||
| 2006 | 447 | 19 | 1,902 | 625 | 1,288 | 996 | 359 | 334 | 326 | |||
| 2007 | 1,203 | 549 | 549 | 1,706 | 1,569 | 359 | 1,002 | 140 | 1,058 | 929 | ||
| 2008 | 336 | 29 | 716 | 1,623 | 2,571 | 2,163 | 1,443 | 601 | 319 | 647 | 1,032 | 548 |
| 2009 | 515 | 849 | 2,079 | 2,264 | 994 | 885 | 883 | 371 | 174 | 511 | ||
| 2010 | 34 | 540 | 9 | 643 | 619 | 14 | 503 | 303 | ||||
| 2011 | 309 | 320 | 801 | 393 | 985 | 390 | 374 | 896 | 23 | 54 | 327 | |
| 2012 | 1,470 | 1,429 | 327 | 50 | 312 | 208 | 674 | 945 | 407 | 552 | 974 | |
| 2013 | 7 | 933 | 922 | 575 | 542 | 431 | 622 | 172 | 74 | 151 | 305 | |
| 2014 | 38 | 125 | 257 | 1,189 | 876 | 447 | 171 | 16 | 64 | 295 | 634 | |
| 2015 | 755 | 370 | 392 | 27 | 121 | 678 | 589 | 202 | 455 | 2 | ||
| 2016 | 403 | 317 | 1,088 | 633 | 1,679 | 1,252 | 387 | 350 | 508 | 991 | 691 | |
| 2017 | 39 | 112 | 56 | 1,075 | 329 | 499 | 117 | 344 | 635 | 162 | 8 | |
| 2018 | 379 | 316 | 531 | 15 | 336 | 666 | 330 | 562 | 1,341 | 344 | 354 | 7 |
| 2019 | 354 | 312 | 510 | 562 | 2,262 | 708 | 1,402 | 1,088 | 623 | 630 | 628 | 334 |
| 2020 | 319 | 780 | 312 | 89 | 103 | 364 | 320 | 176 | 1,135 | 751 | 651 | 1,080 |
| 2021 | 555 | 1,143 | 1,278 | 1,390 | 282 | 62 | 662 | 827 | 429 | 804 | ||
| 2022 | 432 | 952 | 263 | 770 | 1,126 | 1,121 | 49 | 324 | 22 | 593 | 635 | |
| 2023 | 347 | 599 | 53 | 627 | 627 | 746 | 107 | 679 | 271 | 339 | 322 | |
| - = No Data Reported; -- = Not Applicable; NA = Not Available; W = Withheld to avoid disclosure of individual company data. |
| Release Date: 3/29/2024 |
| Next Release Date: 4/30/2024 |
Referring Pages: