|
Download Data (XLS File) |
|
||||||||
|
||||||||
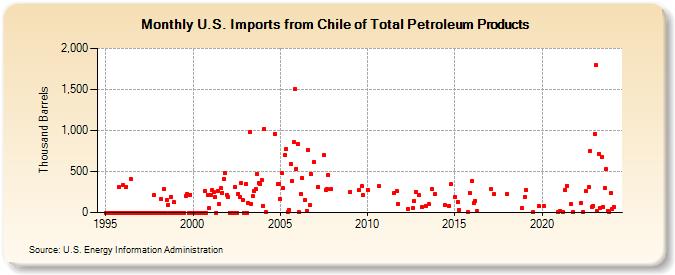
| U.S. Imports from Chile of Total Petroleum Products (Thousand Barrels) | ||||||||
| Year | Jan | Feb | Mar | Apr | May | Jun | Jul | Aug | Sep | Oct | Nov | Dec |
|---|---|---|---|---|---|---|---|---|---|---|---|---|
| 1995 | 0 | 0 | 0 | 0 | 0 | 0 | 0 | 0 | 0 | 306 | 0 | 0 |
| 1996 | 330 | 0 | 315 | 0 | 0 | 412 | 0 | 0 | 0 | 0 | 0 | 0 |
| 1997 | 0 | 0 | 0 | 0 | 0 | 0 | 0 | 0 | 0 | 208 | 0 | 0 |
| 1998 | 0 | 0 | 168 | 0 | 285 | 0 | 151 | 94 | 0 | 190 | 0 | 125 |
| 1999 | 0 | 0 | 0 | 0 | 0 | 0 | 0 | 201 | 225 | 0 | 220 | 0 |
| 2000 | 0 | 0 | 0 | 0 | 0 | 0 | 0 | 0 | 262 | 0 | 216 | 50 |
| 2001 | 213 | 270 | 249 | 187 | 0 | 268 | 101 | 294 | 243 | 407 | 478 | 220 |
| 2002 | 190 | 0 | 0 | 0 | 0 | 314 | 0 | 230 | 192 | 364 | 148 | 0 |
| 2003 | 345 | 0 | 111 | 979 | 110 | 197 | 258 | 281 | 471 | 359 | 343 | 391 |
| 2004 | 85 | 1,020 | 5 | 962 | 342 | 352 | ||||||
| 2005 | 163 | 476 | 295 | 697 | 772 | 2 | 35 | 597 | 387 | 858 | 1,506 | 535 |
| 2006 | 839 | 1 | 227 | 427 | 151 | 25 | 767 | 89 | 468 | 620 | ||
| 2007 | 313 | 701 | 277 | 285 | 457 | 281 | ||||||
| 2009 | 256 | 269 | 319 | 208 | ||||||||
| 2010 | 278 | 318 | ||||||||||
| 2011 | 233 | 261 | 107 | |||||||||
| 2012 | 46 | 57 | 139 | 251 | 218 | |||||||
| 2013 | 65 | 83 | 99 | 284 | 221 | |||||||
| 2014 | 92 | 80 | 343 | |||||||||
| 2015 | 186 | 133 | 32 | 1 | 244 | |||||||
| 2016 | 387 | 118 | 144 | 15 | ||||||||
| 2017 | 283 | 228 | ||||||||||
| 2018 | 226 | 57 | ||||||||||
| 2019 | 193 | 272 | 1 | 74 | ||||||||
| 2020 | 84 | 6 | ||||||||||
| 2021 | 15 | 2 | 277 | 327 | 102 | 8 | ||||||
| 2022 | 121 | 5 | 259 | 309 | 746 | 68 | 86 | |||||
| 2023 | 954 | 1,798 | 18 | 715 | 61 | 682 | 70 | 302 | 526 | 21 | 9 | 235 |
| 2024 | 48 | |||||||||||
| - = No Data Reported; -- = Not Applicable; NA = Not Available; W = Withheld to avoid disclosure of individual company data. |
| Release Date: 3/29/2024 |
| Next Release Date: 4/30/2024 |
Referring Pages: