|
Download Data (XLS File) |
|
||||||||
|
||||||||
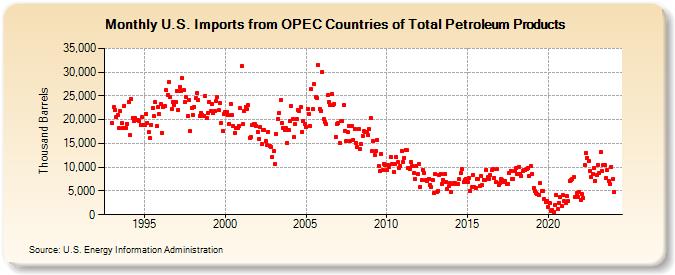
| U.S. Imports from OPEC Countries of Total Petroleum Products (Thousand Barrels) | ||||||||
| Year | Jan | Feb | Mar | Apr | May | Jun | Jul | Aug | Sep | Oct | Nov | Dec |
|---|---|---|---|---|---|---|---|---|---|---|---|---|
| 1993 | 19,346 | 22,711 | 22,087 | 20,593 | 21,047 | 18,209 | 21,766 | 19,230 | 18,179 | 22,931 | 18,286 | 19,178 |
| 1994 | 23,798 | 16,734 | 24,331 | 20,378 | 19,758 | 20,405 | 19,978 | 19,910 | 19,815 | 18,957 | 20,478 | 18,942 |
| 1995 | 18,906 | 21,292 | 19,379 | 17,406 | 16,123 | 18,887 | 22,537 | 20,699 | 23,638 | 18,677 | 22,606 | 21,141 |
| 1996 | 23,224 | 17,291 | 22,741 | 22,862 | 26,176 | 25,284 | 27,927 | 24,814 | 22,246 | 23,750 | 23,060 | 23,721 |
| 1997 | 26,073 | 22,088 | 26,942 | 26,102 | 28,752 | 26,144 | 23,764 | 24,700 | 20,742 | 24,142 | 17,598 | 22,436 |
| 1998 | 21,055 | 22,735 | 24,464 | 25,546 | 24,189 | 20,839 | 21,428 | 21,015 | 20,872 | 24,971 | 20,275 | 21,443 |
| 1999 | 23,810 | 21,742 | 23,293 | 21,320 | 21,849 | 23,921 | 24,800 | 22,008 | 23,438 | 19,372 | 17,636 | 21,277 |
| 2000 | 21,556 | 21,676 | 20,924 | 19,149 | 23,373 | 20,905 | 18,627 | 17,249 | 18,304 | 18,167 | 18,737 | 22,358 |
| 2001 | 31,300 | 19,091 | 21,729 | 22,724 | 22,152 | 23,015 | 16,153 | 16,323 | 18,977 | 19,080 | 19,056 | 18,658 |
| 2002 | 17,511 | 15,889 | 18,496 | 14,917 | 17,804 | 17,798 | 15,433 | 14,613 | 17,446 | 14,419 | 14,264 | 12,115 |
| 2003 | 13,354 | 10,631 | 17,025 | 20,117 | 21,424 | 24,118 | 19,328 | 18,178 | 17,872 | 18,236 | 15,129 | 17,842 |
| 2004 | 19,646 | 22,865 | 20,185 | 16,299 | 18,994 | 20,156 | 22,086 | 21,897 | 22,572 | 17,415 | 19,783 | 19,160 |
| 2005 | 18,520 | 22,259 | 21,174 | 18,733 | 26,413 | 22,144 | 27,452 | 24,814 | 24,458 | 31,506 | 22,277 | 21,824 |
| 2006 | 30,135 | 20,072 | 19,452 | 18,997 | 25,097 | 23,678 | 23,029 | 25,382 | 23,000 | 23,366 | 16,433 | 18,990 |
| 2007 | 19,310 | 15,096 | 19,729 | 19,785 | 22,990 | 17,682 | 15,535 | 17,328 | 18,667 | 15,539 | 18,596 | 15,791 |
| 2008 | 17,957 | 14,998 | 14,268 | 18,070 | 13,849 | 14,829 | 16,648 | 17,549 | 17,342 | 17,413 | 16,685 | 17,972 |
| 2009 | 20,357 | 13,321 | 15,429 | 12,585 | 13,346 | 15,727 | 10,255 | 9,214 | 12,803 | 9,441 | 10,715 | 10,425 |
| 2010 | 9,373 | 10,407 | 10,107 | 12,167 | 10,635 | 9,017 | 10,656 | 12,105 | 10,990 | 9,857 | 10,308 | 13,462 |
| 2011 | 11,109 | 11,998 | 13,663 | 13,537 | 9,925 | 9,590 | 11,123 | 10,299 | 8,835 | 7,540 | 10,313 | 8,580 |
| 2012 | 10,719 | 5,836 | 7,284 | 9,376 | 8,801 | 7,210 | 7,038 | 7,541 | 6,259 | 5,861 | 7,327 | 4,513 |
| 2013 | 8,539 | 4,717 | 5,054 | 8,447 | 8,666 | 6,518 | 7,291 | 8,618 | 6,921 | 5,506 | 5,983 | 6,610 |
| 2014 | 4,729 | 6,432 | 6,663 | 6,664 | 6,366 | 6,473 | 7,435 | 8,707 | 9,530 | 6,787 | 7,301 | 7,555 |
| 2015 | 6,860 | 7,732 | 5,001 | 5,763 | 8,429 | 5,932 | 5,623 | 7,589 | 7,548 | 6,034 | 8,099 | 6,198 |
| 2016 | 7,371 | 7,285 | 9,455 | 7,886 | 7,525 | 8,372 | 9,332 | 9,582 | 7,822 | 6,814 | 9,534 | 6,157 |
| 2017 | 6,625 | 7,518 | 7,339 | 6,824 | 7,082 | 6,551 | 6,516 | 8,748 | 9,298 | 7,524 | 7,516 | 9,249 |
| 2018 | 9,742 | 8,611 | 9,974 | 8,636 | 8,199 | 9,294 | 9,353 | 9,493 | 9,688 | 9,866 | 8,046 | 10,319 |
| 2019 | 8,651 | 5,579 | 4,965 | 4,639 | 4,296 | 4,190 | 6,572 | 4,937 | 4,951 | 3,204 | 2,596 | 2,978 |
| 2020 | 1,646 | 2,439 | 743 | 971 | 647 | 2,042 | 4,132 | 1,243 | 2,553 | 3,653 | 1,768 | 4,056 |
| 2021 | 2,873 | 2,504 | 3,847 | 2,811 | 7,124 | 7,299 | 7,437 | 7,894 | 3,810 | 4,566 | 3,735 | 4,838 |
| 2022 | 3,073 | 4,298 | 3,591 | 10,415 | 12,990 | 11,993 | 11,213 | 9,273 | 7,848 | 8,632 | 9,868 | 7,117 |
| 2023 | 8,441 | 10,474 | 8,801 | 13,172 | 9,289 | 10,528 | 10,463 | 7,767 | 9,428 | 6,991 | 6,409 | 10,058 |
| 2024 | 7,508 | |||||||||||
| - = No Data Reported; -- = Not Applicable; NA = Not Available; W = Withheld to avoid disclosure of individual company data. |
| Release Date: 3/29/2024 |
| Next Release Date: 4/30/2024 |
Referring Pages: